Beginner-Friendly: Visual Machine Learning Playlist Receives Positive Feedback

A Reddit creator launched a visual machine learning playlist that uses animations to help beginners understand core concepts and algorithms.
The article introduces a visual machine learning playlist created by a Reddit creator, designed to lower the barrier to entry for ML through animations and simple explanations. It covers the definition of machine learning, the difference between AI and deep learning, supervised/unsupervised/reinforcement learning, features and labels, train-test split, overfitting and underfitting, linear regression, and logistic regression, with decision trees and random forests coming soon. Visual learning is especially suitable for visual learners, intuitively demonstrating abstract processes such as gradient descent and decision boundaries. The free resource is on the YouTube channel VisualForge AI, and the creator welcomes community feedback. The article also suggests combining visual learning with hands-on practice like scikit-learn.
Why Is Visual Machine Learning Learning More Effective?
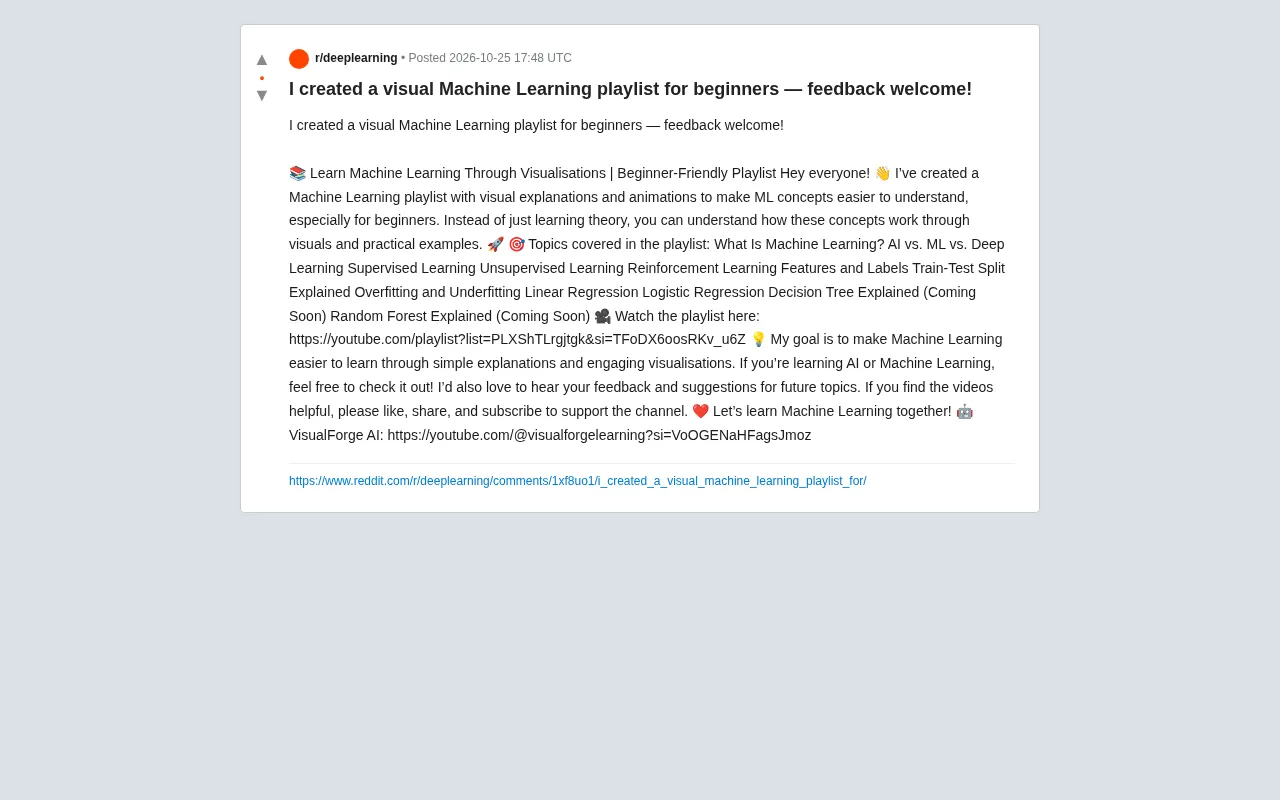
Machine learning concepts are often abstract and difficult to understand, especially for beginners. Recently, a creator on Reddit shared a visual machine learning playlist that makes ML concepts easier to understand through animations and visual explanations. The playlist covers multiple topics ranging from fundamental concepts to common algorithms, aiming to help learners master knowledge through visuals and examples rather than just staying at the theoretical level.
According to the creator, the goal of this playlist is to "make machine learning easier to learn through simple explanations and engaging visualizations." This learning approach is particularly suitable for visual learners because charts and animations can intuitively show how algorithms work, such as gradient descent and decision boundaries.
Core Topics Covered by the Playlist
The playlist currently includes the following topics (some coming soon):
- What Is Machine Learning?
- AI vs. ML vs. Deep Learning
- Supervised Learning
- Unsupervised Learning
- Reinforcement Learning
- Features and Labels
- Train-Test Split
- Overfitting and Underfitting
- Linear Regression
- Logistic Regression
- Decision Trees (coming soon)
- Random Forests (coming soon)
These topics cover the key concepts for getting started with machine learning, from basic definitions to common algorithms, with a clear structure. For beginners, this step-by-step arrangement helps build a complete knowledge framework.
Gradient descent is the most commonly used optimization algorithm when training machine learning models. Its core idea is to gradually adjust parameters along the opposite direction of the loss function's gradient so that the loss value keeps decreasing. Visualization usually displays the loss function as a contour plot or 3D surface, with a small ball or arrow indicating the parameter update path: if the learning rate is too large, the path will oscillate or even diverge; if too small, convergence will be slow. Understanding gradient descent helps grasp why linear regression, logistic regression, and even neural networks are able to "learn."
Decision boundaries are the dividing lines (curves in 2D, hyperplanes in higher dimensions) that classification models use to separate different categories in feature space. Visualizing decision boundaries can intuitively show a model's classification capability and complexity: boundaries that are too simple may lead to underfitting, while overly winding boundaries may lead to overfitting. Algorithms such as logistic regression, decision trees, and support vector machines produce decision boundaries of different shapes. Animations demonstrating how boundaries change with training iterations are an effective way to understand the behavior of classification algorithms.
Advantages and Feedback of Visual Learning
Visual learning is not a new concept, but systematically applying it to machine learning education is still worth attention. By showing the training process and changes in decision boundaries through animations, learners can understand algorithm behavior more intuitively. For example, a visual comparison of overfitting and underfitting can help beginners quickly grasp the trade-off in model complexity.
In the post, the creator expressed hope for feedback and suggestions to determine future topics. This kind of community interaction helps continuously optimize the content. Currently, the playlist has received some attention on Reddit, but there has not yet been a large amount of user feedback.
Overfitting and underfitting are two extremes of the model complexity trade-off. Underfitting means the model is too simple and has not even learned the basic patterns in the training data, resulting in high training error and high test error. Overfitting means the model is too complex and has also learned the noise in the training data, resulting in very low training error but significantly higher test error. Visualization usually compares fitting curves of different complexity on the same dataset: a low-complexity model draws an overly flat line, while a high-complexity model passes through every training point but deviates from the true trend. This comparison helps beginners understand why techniques such as regularization, cross-validation, and early stopping are necessary.
Train-test split is a fundamental step for evaluating a model's generalization ability. Data is usually randomly divided into a training set and a test set in a certain ratio (such as 80/20). The model learns only on the training set and is then evaluated on the test set to measure its performance on unseen data. If training data is used directly for evaluation, the model may give an artificially high accuracy because it has "memorized" the data. Visualization can show the consistency of data distribution before and after the split, and why cross-validation is also needed when the amount of data is small to obtain more stable evaluation results.
How to Access and Support
The playlist can be watched on YouTube on the channel VisualForge AI. The creator encourages viewers to like, share, and subscribe to support the channel's development. For beginners currently learning AI or machine learning, this is a free resource worth trying.
Tip: Although visual learning is great, it is recommended to combine it with hands-on practice (such as using libraries like scikit-learn) to consolidate understanding.
Summary
This visual machine learning playlist provides an intuitive learning approach for beginners, covering core concepts and common algorithms. Although the content is still being improved, its visual teaching approach is commendable. If you are interested in machine learning, you might want to check it out and give feedback to help the creator improve the content.
One-line Summary
A Reddit creator has launched a visual machine learning playlist that uses animations to help beginners understand core concepts and algorithms.
Paragraph Summary
The article introduces a visual machine learning playlist created by a Reddit creator, designed to lower the barrier to entry for ML through animations and simple explanations. The playlist covers topics such as the definition of machine learning, the difference between AI and deep learning, supervised/unsupervised/reinforcement learning, features and labels, train-test split, overfitting and underfitting, linear regression, and logistic regression, with decision trees and random forests coming soon. The author notes that visual learning is especially suitable for visual learners, as it can intuitively demonstrate abstract processes such as gradient descent and decision boundaries, helping to understand the model complexity trade-off. This free resource is published on the YouTube channel VisualForge AI, and the creator welcomes community feedback to determine future topics. The article also reminds readers that visual learning should be combined with hands-on practice such as scikit-learn to consolidate understanding.
Related articles

Private Key Set to 4? CA's Elementary Mistake Leaves TLS Exposed
CA eMudra set private keys to tiny values like 4, making TLS certificates brute-forceable. A Computerphile video demonstrates the full process from extracting public keys to forging certificates, and explores the fragility of the PKI trust chain.

How Gen Turns Data into Decisions with ChatGPT Work
In an OpenAI user case, business leader Gen shares how ChatGPT Work turns data into decisions: within hours of launch, teams can judge whether integrations and onboarding flows work, shifting decision iteration from hundreds of trial-and-error attempts to a fast feedback loop.

ChatGPT vs. Claude In-Depth Comparison: Strong at Coding but Weak at Research — How to Bridge the Gap?
A user considers switching from ChatGPT to Claude, finding Claude stronger at coding but shallower at research. We analyze the differences and share tips to make Claude's research deeper.