NVIDIA Minerva: Turning Telemetry Chaos into Peak GPU Capacity

NVIDIA Minerva normalizes and correlates cross-GPU and network telemetry to turn observational data into AI factory capacity decisions.
The Minerva project disclosed on NVIDIA's developer blog addresses the difficulty of locating hidden bottlenecks in AI factories where hundreds of thousands of GPUs are interconnected via Spectrum-X, proposing an analytics framework that spans from telemetry to capacity. The article notes that GPU and network telemetry data is voluminous, heterogeneous, and semantically inconsistent, forming "chaos" that makes it hard for operations teams to align downclocking, packet loss, and scheduling changes within the same spatiotemporal coordinate system. Minerva first unifies collection and normalization of cross-GPU and cross-network telemetry, then performs correlation analysis, and finally feeds results back into operational actions. Its evaluation criterion shifts from "whether metrics cross thresholds" to "how much usable compute is wasted," pushing AI factory operations from reactive troubleshooting toward proactive output optimization, while also highlighting that balancing telemetry coverage and collection overhead remains an implementation challenge.
AI factories have become one of the most complex operating environments humans have ever built. Hundreds of thousands of GPUs are interconnected via NVIDIA Spectrum-X Ethernet, and any hidden bottleneck can quietly erode the compute utilization of an entire cluster. The Minerva project, disclosed on NVIDIA's developer blog, is a systematic response to this pain point: it transforms telemetry data that would otherwise be scattered across monitoring dashboards and logs into signals that can directly drive capacity decisions.
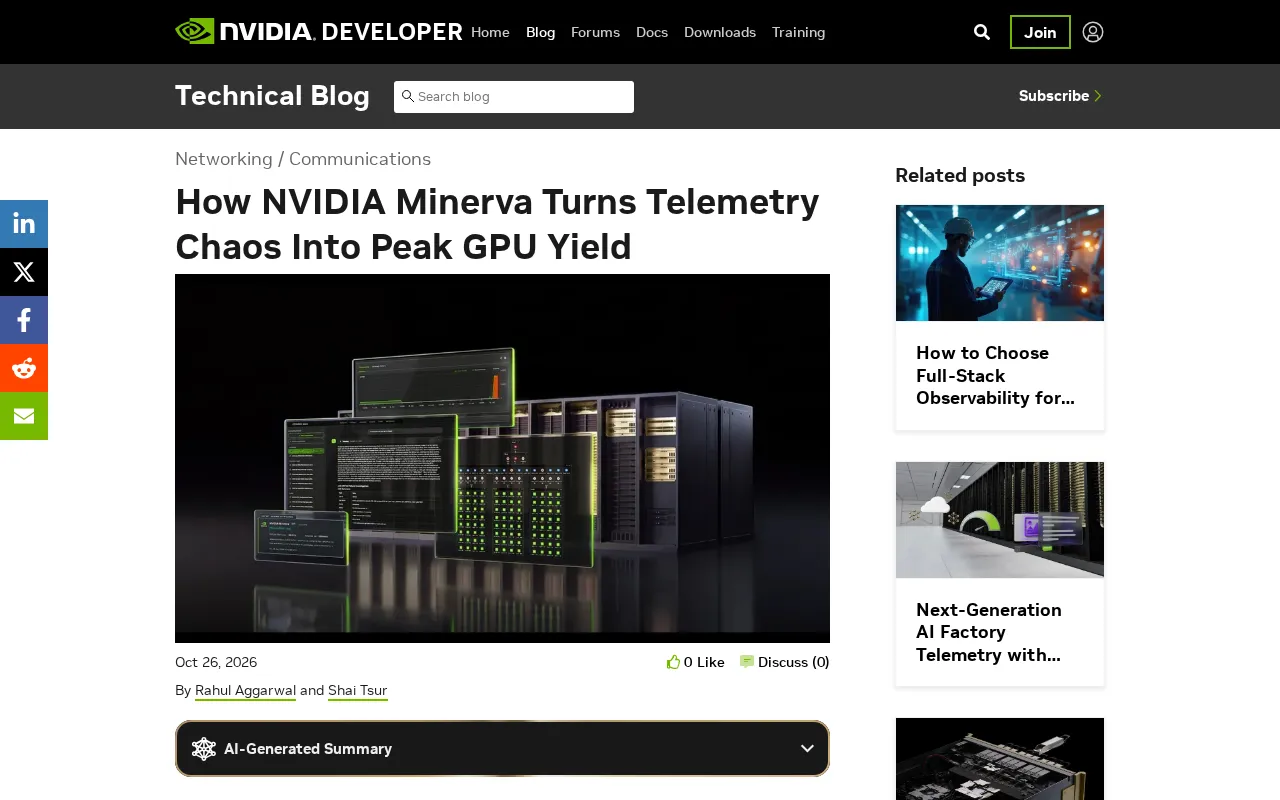
Why telemetry data turns into "turbulence"
In large-scale GPU clusters, every accelerator continuously emits metrics such as power consumption, temperature, clock speed, memory usage, and link error rates, while the switch side produces network telemetry including port congestion, packet loss, and retransmissions. The data itself is not scarce; what is scarce is the ability to align it all within the same spatiotemporal coordinate system.
Once the dimensions are misaligned, operations teams see only unrelated curves: a GPU has downclocked, but whether the network device counters were anomalous at the same moment, or whether the scheduling behavior of the upper-layer workload changed, often requires manual cross-referencing. NVIDIA describes this state as telemetry "chaos"—large data volume, heterogeneous sources, inconsistent semantics—where the real loss of capacity is drowned in noise.
Telemetry in the data center context refers to operational status data that devices automatically report, as distinct from passively polled monitoring metrics. GPU telemetry is typically exposed by NVML (NVIDIA Management Library) or DCGM (Data Center GPU Manager), covering power, temperature, SM clock, memory bandwidth utilization, ECC error counts, NVLink link status, and more; on the network side, switches report fine-grained information such as port queue depth, PFC pause frames, and ECN marks via gNMI, sFlow, INT (In-band Network Telemetry), and similar mechanisms. These data sources differ in sampling frequency, timestamp precision, and naming conventions—some at millisecond granularity, others aggregated per second—so directly overlaying them produces temporal misalignment. "Aligning within the same spatiotemporal coordinate system" essentially means solving three layers of problems: clock synchronization (e.g., PTP), sampling alignment, and semantic mapping, which is also the technical foundation for whether subsequent correlation analysis can hold up.
Minerva's design approach: from observation to output
Judging from the positioning NVIDIA has published, Minerva is not just another monitoring dashboard but an analytics layer built around the ultimate goal of "GPU capacity." Its core work can be summarized in a few steps: first, uniformly collect and normalize telemetry across GPUs and networks; then perform correlation analysis on that basis; and finally feed the conclusions back into operational actions.
The key difference in this design lies in the evaluation criterion. Traditional monitoring cares about "whether a metric has crossed a threshold"; Minerva cares about "how much usable compute has been wasted." The two seem similar but lead in completely different directions: the former easily generates large numbers of harmless alerts near thresholds, while the latter must convert different phenomena—downclocking, idling, retries, congestion—into a single yardstick in order to compare priorities.
Why a unified data foundation matters
The role of Spectrum-X Ethernet in AI clusters means network telemetry cannot be an afterthought. When a training job spans tens of thousands of GPUs, tiny fluctuations at the link level are amplified by synchronous communication and ultimately manifest as whole batches of GPUs waiting idle. Putting network-side data and compute-side data into the same analytical framework is the precondition for Minerva to locate "invisible capacity loss."
Spectrum-X is NVIDIA's Ethernet platform for AI clusters, comprising Spectrum-4 switches, BlueField-3 DPUs, and the accompanying software stack. Its core selling points are Adaptive Routing and congestion control, used to approach InfiniBand's tail-latency performance in RoCEv2 environments. In collective communication (such as All-Reduce), all GPUs must exchange gradients synchronously, and microsecond-level jitter on any link causes an entire group of GPUs to wait, creating a "bucket effect." Therefore, metrics such as PFC storms, ECN marking ratios, and link bit error rates on the network side are strongly causally correlated with SM idle rates and downclocking events on the GPU side. Only by placing both types of telemetry into the same analytical framework can "a particular training run slowed down" be attributed to a specific link or a specific card, rather than remaining a vague judgment that "the network seems to be jittering."
What this means for AI factory operations
NVIDIA defines the AI factory as a new type of production facility whose output unit is effective compute rather than traditional goods. In this context, Minerva's value is not just improved troubleshooting efficiency but a shift in operations from reactive response to output optimization.
For operations teams, this means moving the focus earlier: rather than retrospecting after a job fails, intervene when capacity shows a subtle decline. For platform builders, this means the telemetry system must be designed with unified semantics from the start, rather than stitching together multiple siloed systems after the fact.
A detail worth noting: the implementation of such capabilities depends heavily on data quality and collection coverage. Telemetry gaps distort correlation analysis, while excessive collection introduces additional overhead, and how to balance the two remains a challenge in engineering practice.
Goodput is the key concept for understanding Minerva's evaluation system. It refers to the proportion of a cluster's peak compute that is actually used for effective computation per unit time—equal to peak compute multiplied by utilization, minus losses caused by downclocking, idling, retries, and communication waits. In contrast, traditional monitoring focuses on "whether a threshold has been crossed," which can only capture discrete anomalies and cannot quantify continuous efficiency erosion. The industry commonly uses MFU (Model FLOPs Utilization) or the cluster-level proportion of effective training time to measure this indicator. Only by converting heterogeneous phenomena—downclocking, link retransmissions, job queuing—into a unified "wasted compute equivalent" can repair priorities be ranked across different failures, which is also the methodological prerequisite for shifting from SRE-style alert-driven operations to output-driven operations.
A clearer view of capacity
The signal from Minerva is clear: competition in AI infrastructure is shifting from per-card performance to system-level effective output. In clusters of hundreds of thousands of GPUs, what determines actual compute is often not peak specifications but the losses hidden by telemetry chaos. Turning observational capability into the language of capacity is NVIDIA's directional answer for AI factory operations.
One-line Summary
NVIDIA Minerva normalizes and correlates cross-GPU and network telemetry, turning observational data into capacity decision signals for AI factories.
Related articles

T3 Code: The Open-Source AI Coding Assistant's Comeback Story
T3 Code is an open-source AI coding assistant that unifies subscriptions like Codex and Claude, with powerful remote control and parallel task management.

Never Elected, Yet Ruled New York for 30 Years: The Ultimate Case Study in the Mechanics of Power
Robert Caro's biographies reveal how unelected Robert Moses ruled New York for 30 years through legal drafting and public authorities, and how Lyndon Johnson built leverage as a "powerless" Senate Majority Leader. Unpacking the underlying logic of accumulating and sustaining power.

The CPython 3.10 Recursion Trap and Synthetic Recovery in TokenGuard, an LLM Circuit Breaker
TokenGuard's author recounts a recursion crash caused by OrderedDict.pop in CPython 3.10 and introduces v0.3.0's Loop Nudge synthetic recovery, inline DLP scanning, and other new LLM agent circuit-breaker capabilities.