After Extreme Weather: How Agentic AI Predicts Agricultural Losses

WxCrop agent uses causal analysis and interpretable weather indices to quantify agricultural losses from extreme weather.
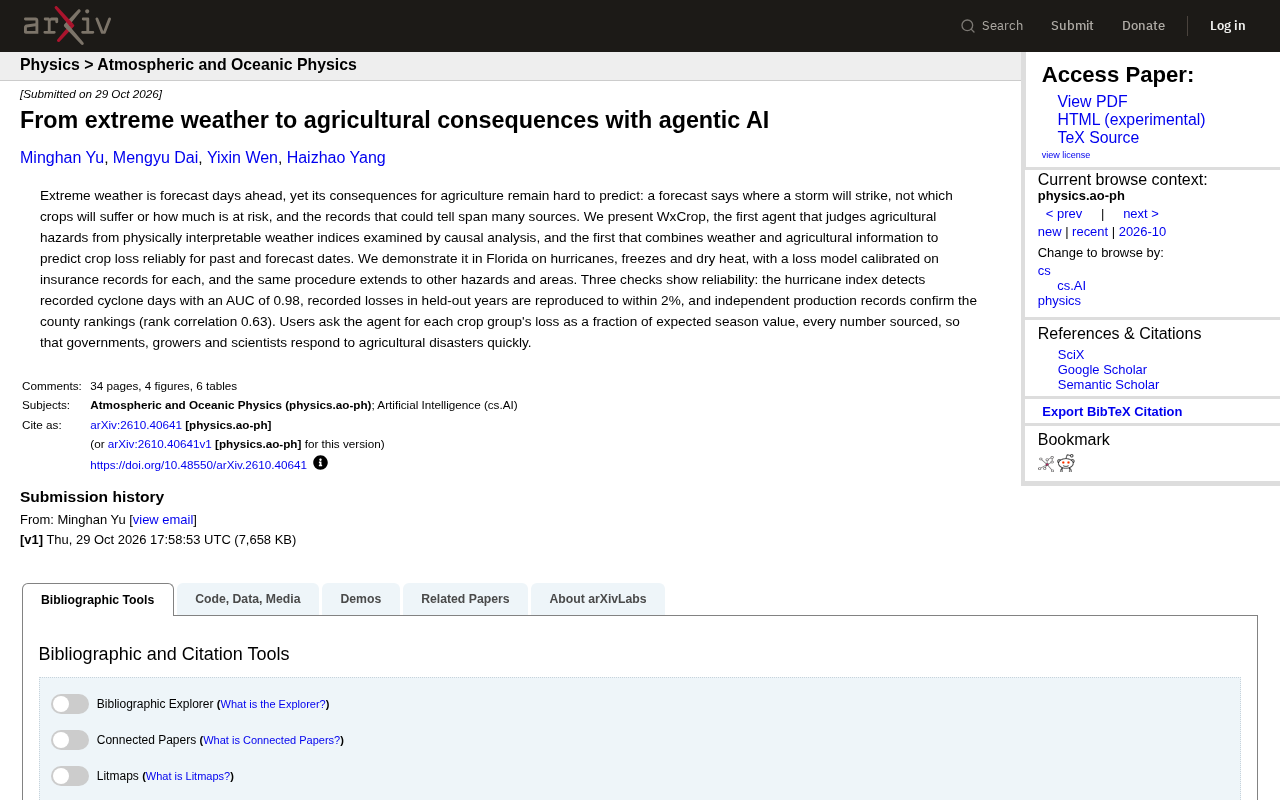
WxCrop is an agent that combines weather and agricultural information and uses causal analysis to assess agricultural disasters. It constructs physically interpretable weather indices (hurricanes, freezes, dry heat, etc.), identifies causal chains between indices and agricultural losses, and calibrates the loss model with insurance records. In Florida validation, the hurricane index achieved an AUC of 0.98, held-out year loss reproduction error was within 2%, and county-level rankings had a rank correlation of 0.63. The agent provides traceable loss estimates via natural language Q&A. The method can extend to other hazards and regions but relies on insurance data availability.
Extreme weather forecasts can tell us days in advance where a storm will make landfall, but they cannot answer a question that is critical for agriculture: which crops will be damaged, and how large will the losses be? The gap between traditional meteorological models and agricultural data often makes disaster response lag behind. A recent study proposes the WxCrop agent, which attempts to fill this gap using causal analysis and physically interpretable weather indices.
From Weather to Crop Loss: The Overlooked Causal Chain
Weather forecasts can pinpoint a hurricane's path and intensity with precision, but agricultural losses depend on many more factors: crop type, growth stage, soil conditions, and vulnerability patterns found in historical insurance records. This information is scattered across different data sources and is difficult to integrate quickly. The core idea of WxCrop is to stop asking a model to predict losses from weather data in a black-box manner. Instead, it first constructs physically interpretable weather indices (for example, indicators related to hurricanes, freezes, and dry heat), and then uses causal analysis to determine the causal relationship between these indices and agricultural losses.
The advantage of this approach lies in interpretability. Users not only know the predicted loss value, but can also trace which weather index triggered the risk judgment and the causal mechanism behind it. According to the original paper, WxCrop is the first agent that combines weather and agricultural information and uses causal analysis for agricultural disaster assessment.
Causal analysis here does not refer to correlation in general, but to interventional inference under the Structural Causal Model (SCM) framework. Traditional machine learning models can easily learn spurious associations between weather variables and losses (for example, a certain type of weather happens to coincide with the growing period of a specific crop), whereas causal analysis requires the model to identify the directed path of "weather index change → crop physiological stress → yield loss." In practice, causal graphs (DAGs) are often used to specify the dependency structure among variables, and then methods such as do-calculus or propensity score matching are used to estimate causal effects. WxCrop treats physically interpretable indices as treatment variables in the causal graph precisely to prevent black-box models from mistaking irrelevant meteorological fluctuations for disaster-causing factors, thereby improving generalization stability across years and regions.
Evidence from Florida: Hurricanes, Freezes, and Dry Heat
The research team validated the approach in Florida for three types of extreme weather: hurricanes, freezes, and dry heat. For each hazard, they calibrated the loss model using insurance records. This means that the model's output is not a theoretical projection, but a loss estimate aligned with actual claims data.
Three checks demonstrated the model's reliability. First, the hurricane index achieved an AUC of 0.98 in identifying recorded hurricane days, indicating strong discriminative ability. Second, in held-out years, the model reproduced losses within 2% of actual records. Third, independent yield records confirmed county-level rankings, with a rank correlation coefficient of 0.63. These metrics indicate that WxCrop not only fits historical data but also has a certain degree of generalization ability.
Interestingly, the pipeline is not limited to Florida or these three types of hazards. The paper notes that the same method can be extended to other hazards and regions, as long as corresponding weather indices can be constructed and insurance records can be obtained for calibration.
AUC (Area Under the ROC Curve) is a commonly used metric for evaluating the discriminative ability of binary classification models, with values between 0 and 1. The ROC curve plots the false positive rate on the horizontal axis and the true positive rate on the vertical axis, and AUC equals the area under the curve: 0.5 corresponds to random guessing, while 1.0 represents perfect discrimination. In the article, the hurricane index's AUC of 0.98 for identifying recorded hurricane days means that if one hurricane day and one non-hurricane day are drawn at random, the probability that the model assigns a higher risk score to the hurricane day is about 98%. It should be noted that a high AUC only indicates strong ranking discrimination ability and does not directly reflect the accuracy of loss amount estimates, which is why the research team separately cross-validated using held-out year error and rank correlation coefficients.
Rank correlation coefficient (usually referring to the Spearman rank correlation coefficient) measures the consistency between the rankings of two variables, rather than the consistency of the values themselves. In calculation, the values of each sample are first converted into ranks, and then the Pearson correlation coefficient is computed on the ranks, with values also ranging from -1 to 1. In the article, independent yield records were used to validate county-level loss rankings, and a rank correlation coefficient of 0.63 indicates a moderate-to-strong positive correlation between the model's ranking of disaster severity and the ranking of actual yield declines. Rank correlation rather than ordinary correlation was chosen because yield records and insurance payouts are not directly comparable in scale or absolute level, but the relative ranking of "which counties are more severe" can be aligned, which is also closer to the practical need to prioritize resource allocation in disaster response.
How the Agent Works: Traceable Loss Q&A
WxCrop provides services in the form of an agent. Users can ask it about the proportion of losses for each crop group relative to expected seasonal output value, and every number comes with a source. This design allows government agencies, growers, and scientists to quickly understand the agricultural impact of a disaster, rather than facing a pile of model outputs that are difficult to interpret.
The agent's interactive mode lowers the barrier to use. Decision-makers do not need a deep background in meteorology or statistics; they only need to ask questions in natural language to obtain loss estimates with traceability information. This is crucial for disaster emergency response, because the time window is often very narrow.
Agent in the AI context refers to a system that can perceive the environment, invoke tools, and autonomously orchestrate multi-step processes to accomplish goals, rather than a model with a single input and output. WxCrop's agent architecture typically includes three components: task planning, tool invocation (such as querying weather indices, retrieving insurance records, and running loss models), and result traceability. After a user asks a question in natural language, the agent breaks it down into several subtasks, invokes the corresponding modules in sequence, and annotates in the final answer which index, which causal path, and which data source each number comes from. This closed loop of "planning—execution—traceability" distinguishes it from traditional weather data dashboards or end-to-end regression models, and makes it more suitable for emergency decision-making scenarios with tight time windows.
Limitations and Outlook
Despite the positive results, the scope of WxCrop is still limited by the availability of insurance records. Calibration of the loss model depends on high-quality insurance data, which may not be available in many regions. In addition, the weather indices on which causal analysis relies need to be designed for different hazard types, and may require revalidation when transferred to new regions.
The paper's authors position WxCrop as a scalable framework rather than an endpoint. As more regions open up agricultural insurance data and the weather index system improves, the agent is expected to play a role in a broader range of agricultural risk management scenarios. The chain from extreme weather to agricultural consequences is gradually being connected through more systematic AI methods.
One-line Summary
WxCrop agent uses causal analysis and interpretable weather indices to quantify agricultural losses from extreme weather.
Paragraph Summary
WxCrop is an agent that combines weather and agricultural information and uses causal analysis to assess agricultural disasters. Instead of letting a model predict losses in a black-box manner, it first constructs physically interpretable weather indices (hurricanes, freezes, dry heat, etc.), then uses causal analysis to identify the causal chain between indices and agricultural losses, and calibrates the loss model with insurance records. In validation on three hazard types in Florida, the hurricane index achieved an AUC of 0.98 in identifying recorded hurricane days, the loss reproduction error in held-out years was within 2%, and independent yield records confirmed county-level rankings with a rank correlation coefficient of 0.63. The agent provides the proportion of losses for each crop group relative to expected seasonal output value in natural language Q&A form, and every number is traceable. The method can be extended to other hazards and regions, but depends on the availability of insurance records.
Related articles

Cursor AI in Practice: Weighing Efficiency Gains Against Costs in an AI IDE
An in-depth look at Cursor AI IDE's interface layout, four modes (Agent/Plan/Debug/Ask), model selection, and Git context integration, with hands-on demos weighing subscription costs against going direct to Claude.

Free Landing Page Design Rules Library: A Practical Guide for Claude Code and Cursor
A free landing page design skill for Claude Code and Cursor: MIT licensed, nearly 9,000 stars, asks about offer/audience/action before planning 12 sections with hard font and spacing constraints.

Cursor Keeps Writing Wrong Code? The Problem May Be Context, Not Prompts
Cursor keeps writing wrong code? The problem may be context, not prompts. Learn how to supply relevant files, full error messages, and expected results, plus a plan-first, small-step, test-driven workflow to reduce AI coding errors—while remembering code review remains the developer's job.