Codex Agent Engineering in Practice: A Three-Layer Verification Framework for Testing and Observability

Verify Agent behavior with a three-layer testing framework—local rules, host-flow controllable responses, and real-task acceptance—plus observability for fault localization.
The Codex series finale focuses on verifying Agent behavior. The author proposes a three-layer verification framework: local rule tests (fixed input/output), host flow tests (simulating model calls with controllable responses to check tool execution and result write-back), and real-task acceptance (actual repository and problem). Assertions should check tool names, parameters, callid association, result destination, and actual file changes—not internal implementation. Concurrency tests should use synchronization barriers rather than timing assertions, and distinguish execution, completion, and write ordering. Failure cases need explicit expected side effects, while runtime telemetry correlates events via session info, callID, duration, and status to aid troubleshooting. Finally, turn failures into regression cases and save real-scenario acceptance criteria.
Series finale: Verifying Agent behavior isn't just about what the model said at the end—you need evidence along the entire chain from "model decision → host execution → result write-back → state achievement."
In the previous 12 chapters, we covered how Codex advances tasks, invokes tools, manages context, operates the interface, and recovers from interruptions. But after modifying the system, there's often uncertainty: Are tool calls correct? Did it really stop after an approval rejection? After resuming a conversation, does the next request carry the information it should? These questions require dedicated evidence. This chapter starts from the test helper infrastructure in the Codex source code to examine which problems can be pinned down for repeated verification and which must be left to real-world judgment.
The Three-Layer Verification Framework: From Fixed Rules to Real Tasks
The biggest mistake when verifying Agent behavior is looking only at the final natural-language output. When the model says "the problem is fixed," that only proves it generated that sentence—it doesn't mean it modified files, ran relevant tests, or satisfied the original requirements. There are three easily confused positions here: when the model believes this round of reasoning is over, when a tool return indicates execution reached its own success condition, and whether the user's goal was actually completed—the last one must be judged against real files and task requirements.
Codex's testing system can be broken into three layers:
Layer 1: Local rule tests. Given a fixed input, you must get a fixed result—for example, how tool output is truncated, how call parameters are processed. Small scope, fast execution, high stability.
Layer 2: Host flow tests. Suppose the model returns a tool call—does the host correctly execute it, record the result, and construct the next request? This layer substitutes controllable responses for the real model, so the test reaches the same point every time.
Layer 3: Real task acceptance. Given an actual repository and a real problem, check whether the model and tools working together satisfy the acceptance criteria. This layer can catch gaps the first two layers miss—for example, a tool skipping a requirement—but results depend more on the model, environment, and task itself.
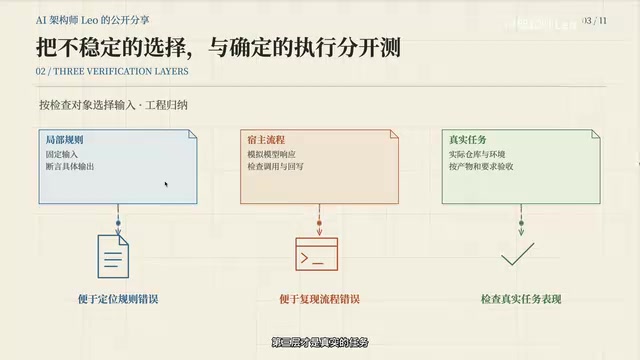
These three layers are progressive. Task acceptance sits at the bottom because it needs evidence from the preceding layers to support it. Integration tests can verify result write-back, but they cannot conclude that the model will always choose the right tool or the right evidence in every real task.
Reproducing Model Behavior with Controllable Response Streams
Codex's source code includes a set of practical test utilities that can assemble the model's response stream: first return a function call entry, then return the response completion time; the next request receives another preset response. Tests can therefore precisely control when the model asks to invoke a tool. Corresponding helper functions attach these response segments in order to a local mock service—Codex still goes through its own request and tool-handling flow, but the model output it receives is arranged by the test.
On the other side, the mock service captures the requests Codex actually sends, letting us check whether the second request carries the result of the first call—whether the callid is correct and whether the order is right. This kind of test is especially good for pinning down pitfalls previously encountered: codify the call sequence that caused the error, then re-run after fixing the code.
But remember: a mock model will always return what we want, and it cannot replace verification of whether a real model "can choose the right action."
callid (call ID) is the unique correlation identifier between a tool call and its result. In the OpenAI function-calling protocol, the model generates a call_id each time it initiates a tool call. After the host executes the tool, it must pair the result with the corresponding call_id and send it back so the model can correctly understand which result belongs to which call. Codex's tests pay special attention to callid because once the association is broken (for example, a result attached to the wrong call), the model will continue reasoning based on incorrect information, leading to behavioral deviation. This is also why assertions must check callid alignment, not just tool names and parameters.
Where Assertions Should Go
Once responses are controllable, the placement of assertions determines test quality. Codex's approach is threefold:
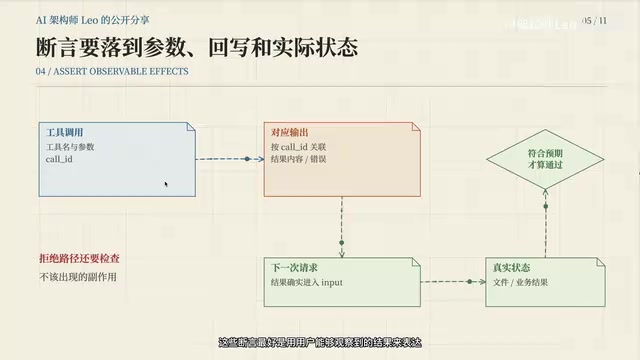
- The call itself: Is the tool name correct? Are the parameters the expected set?
- The association between call and result: Especially the callid, ensuring the result is attached back to the correct call.
- Where the result ultimately goes: If the first tool returns a test failure, the corresponding result should be findable in the next request. The test helper object provides methods to read the request list and look up function output by callid; tool lifecycle tests also record the session history visible when the tool starts, to verify order and content.
If a tool modifies files, you must read the actual files to check the changes—seeing that the model proposed a modification call does not prove the file was changed correctly. For approval rejections, conversely, check whether side effects that should not occur did occur. These assertions are best expressed in terms of user-observable outcomes rather than tied to internal function decomposition; as long as call relationships and final behavior are consistent, changes in implementation structure should not cause a wholesale test rewrite.
Concurrency Testing: Synchronization Barriers Are More Reliable Than Timing Assertions
The easiest way to write unreliable concurrency judgments is to assume that because two tasks both finish quickly, they must have run in parallel—machine speed, process startup, and system calls all affect results. Codex's arrangement is more concrete: make two test tools both reach the same synchronization barrier, and only continue once both have participated. If the execution layer runs them serially, the first will wait until the barrier times out, exposing the serialization problem.
Codex keeps a fairly loose time limit to leave margin for slower CI scheduling—there's no need to treat a particular millisecond count as a performance promise for all environments. Moreover, execution order, completion order, and the order of writes to history are three different problems: after proving two tools ran concurrently, you still need to check how results are aggregated; you cannot infer that all ordering semantics are correct from a single concurrency test.
Synchronization barrier is a concurrency programming primitive that requires a specified number of threads or tasks to reach a certain point before they can all continue together. In testing, barriers are used to verify whether two operations truly run in parallel: if the host executes tools serially, the first tool will wait until the barrier times out, exposing the problem. Compared with relying on timing thresholds, barriers don't depend on machine speed and produce more deterministic results. But a barrier can only prove "running at the same time"; it cannot prove that result aggregation order is correct, so additional assertions are still needed to check how results are written to history.
Failure Cases and Observability: Walking on Two Legs
Happy-path cases cover only part of the picture. The places where Agents are truly hard to debug are often when a task is rejected halfway through, canceled, or resumes missing a segment of history. Failure cases should first spell out expectations: after an approval rejection, no side effects of the rejected action should occur; input appended during a run should enter subsequent requests at a position where consumption is allowed; after compression and recovery, the currently visible history should retain the agreed content. This repository has separate tests for approval, input submission, compression recovery, forking, and more, each checking different things—rather than replacing them all with a single "can still finish when something goes wrong" assertion.
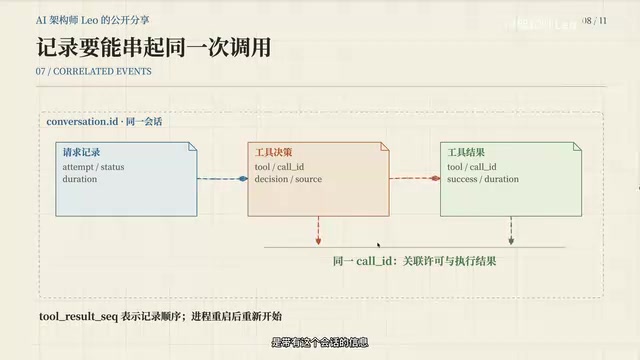
Tests help us find problems early, and runtime records help us explain what already happened—two dimensions. If logs contain only "started" and "finished," it's hard to tell whether they refer to the same task. Codex's telemetry carries session information, tool decisions, and tool results, recording tool name, namespace, and call ID, so a particular permission decision can be correlated with the subsequent execution result. Request records include duration, status, and attempt count; tool results also have an in-process incrementing sequence number that represents the order in which results were recorded—not the order in which tools started, nor a permanent number that remains continuous after restart. Under concurrency, it cannot be used for call correlation.
When troubleshooting the page, I first try to connect the segments of the same call before considering how many charts to add. Only when the user says "that step just got stuck" do we have a chance to determine whether it was stuck during request approval or tool execution. More records make troubleshooting easier, but they also bring size and information-exposure problems: complete logs in tool result events can include parameters and restricted output previews; trace events use metadata such as parameter length, output length, function, and tool source. Both sides share call ID, timestamp, success flag, and preview truncation information. Output previews are truncated according to a budget, trying to stop at character boundaries and append an explanation—this marker only indicates that the telemetry layer removed content; it does not prove that the original tool result was intact at an earlier stage. User prompts have a separate recording switch; when disabled, a placeholder is used instead—but don't interpret that as automatic removal of all sensitive information from all logs; deployment still requires checking tool parameters, log retention scope, and read permissions.
Telemetry here refers to structured event records generated during Agent runtime, including request attempts, tool decisions, and tool results. Codex's telemetry events carry session ID, call ID, tool name, and namespace, with the goal of connecting multiple stages of a single call. Tool result events also have an in-process incrementing sequence number that represents the order in which results were recorded, not the tool start order or a persisted number. These metadata help reconstruct the timeline during troubleshooting, but note that the preview truncation marker only indicates deletion at the telemetry layer; it does not imply completeness of the original result.
Performance Troubleshooting: Break Down the Timeline Before Changing Timeouts
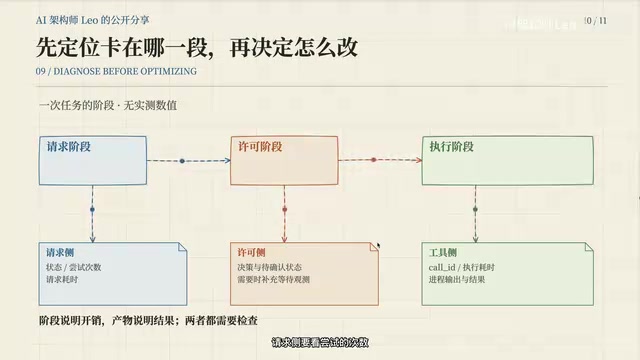
When a user complains that "the task is running long again," looking only at total duration is not enough: the model request may have been retried several times, it may be waiting for permission, or the command process itself may not have exited. You need to break down the timeline to find which segment the time went into: on the request side, look at attempt count, status, and duration; on the tool side, look at decision records, call ID, execution duration, and results; you also need to know the current turn state, combining session events and UI display. Not every wait has an existing independent timer; when one is missing, add observability before making changes. For repeated requests, check the reason for retries; for waits on confirmation, display pending status clearly; for slow commands, look at the process and output—don't inflate the model or all timeout values before locating the cause.
Running fast also doesn't mean the task was done correctly. Performance metrics should explain overhead, files and test results, and acceptance determined by user requirements; look at several kinds of tools together so optimization doesn't become just one ever-shorter duration curve.
Closing: Turn Failures into Reproducible Evidence
Taken together, the whole series forms a complete chain: after a task enters, the model makes decisions based on context; tools go through permission and execution handling; results are written to records; the next request continues to use them; as tasks grow longer, processes and context must be managed; new requirements mid-task require input handling; after restart, recoverable state must be rebuilt; tests and observability are arranged along the flow—important rules are checked with fixed inputs, host flows are reproduced with controllable responses, real tasks are accepted based on actual artifacts, and necessary events are correlated during runtime so that when failures occur, the point of deviation can be located.
Finally, keep the problems you've solved: add regression cases for failures that can be reproduced stably; for problems that require real-world judgment, save the acceptance criteria and scenarios clearly. That way, the next time you adjust tool permissions or context strategy, you'll have something to compare against. If you're also preparing to build an Agent, I recommend starting with a small task and running through all five items—input, calls, results, expected conditions, and verification evidence—before adding capabilities; each additional mechanism should come with a corresponding state checkpoint.
Related articles

LangChain Retry Middleware Configuration: Practices and Selection Guide
Based on Reddit community discussion, this article analyzes LangChain ModelRetryMiddleware retry parameter configuration practices, covering the selection logic and alternatives for key options like max_retries, backoff_factor, and jitter.

Texas Senate Race in Trouble: Why Are Republicans Nervous?
Texas Senate race stirs Republican anxiety. Based on street interviews, this article analyzes the Democratic offensive in funding, organization, and running everywhere, and how Republicans are defending "Texas, Texas" amid the political pendulum effect.

Gemini Chat Now Generates and Edits Google Docs Directly, a New Breakthrough in Office Productivity
Google Gemini's chat interface now generates and edits PDF, Google Docs, Sheets, Slides, Markdown, TXT, and code files. Available to all users; web supports all formats, mobile only PDF for now.