Datastripes: Turn Spreadsheets into Data Stories in One Click

Datastripes launches Data Stories, which auto-generates data stories with charts and conclusions from uploaded spreadsheets, focused on rapid drafting.
Datastripes launched Data Stories on Product Hunt. Users upload a CSV or Excel file, choose the question to answer, and the product automatically generates data stories with headlines, charts, and conclusions, supporting brand colors and 8 publishing formats—compressing days of analyst-designer-writer collaboration into minutes for one person. It targets SMBs and independent creators without dedicated data teams, with core value in automating actionable conclusions rather than deep analysis. It received 93 votes and ranked 7th for the day, but with only 3 comments, real-world performance remains unverified; it also faces challenges in data quality dependence, narrative templating, and brand consistency.
From Spreadsheets to Stories: What Pain Point Does Datastripes Solve?
Every dataset hides a story, but telling that story usually requires an analyst to extract insights, a designer to create charts, and a writer to craft the narrative—three people collaborating over several days. Datastripes' new product Data Stories, launched on Product Hunt, attempts to compress these three roles into one: you simply upload a CSV or Excel file, and it writes headlines, charts, and findings in plain language.
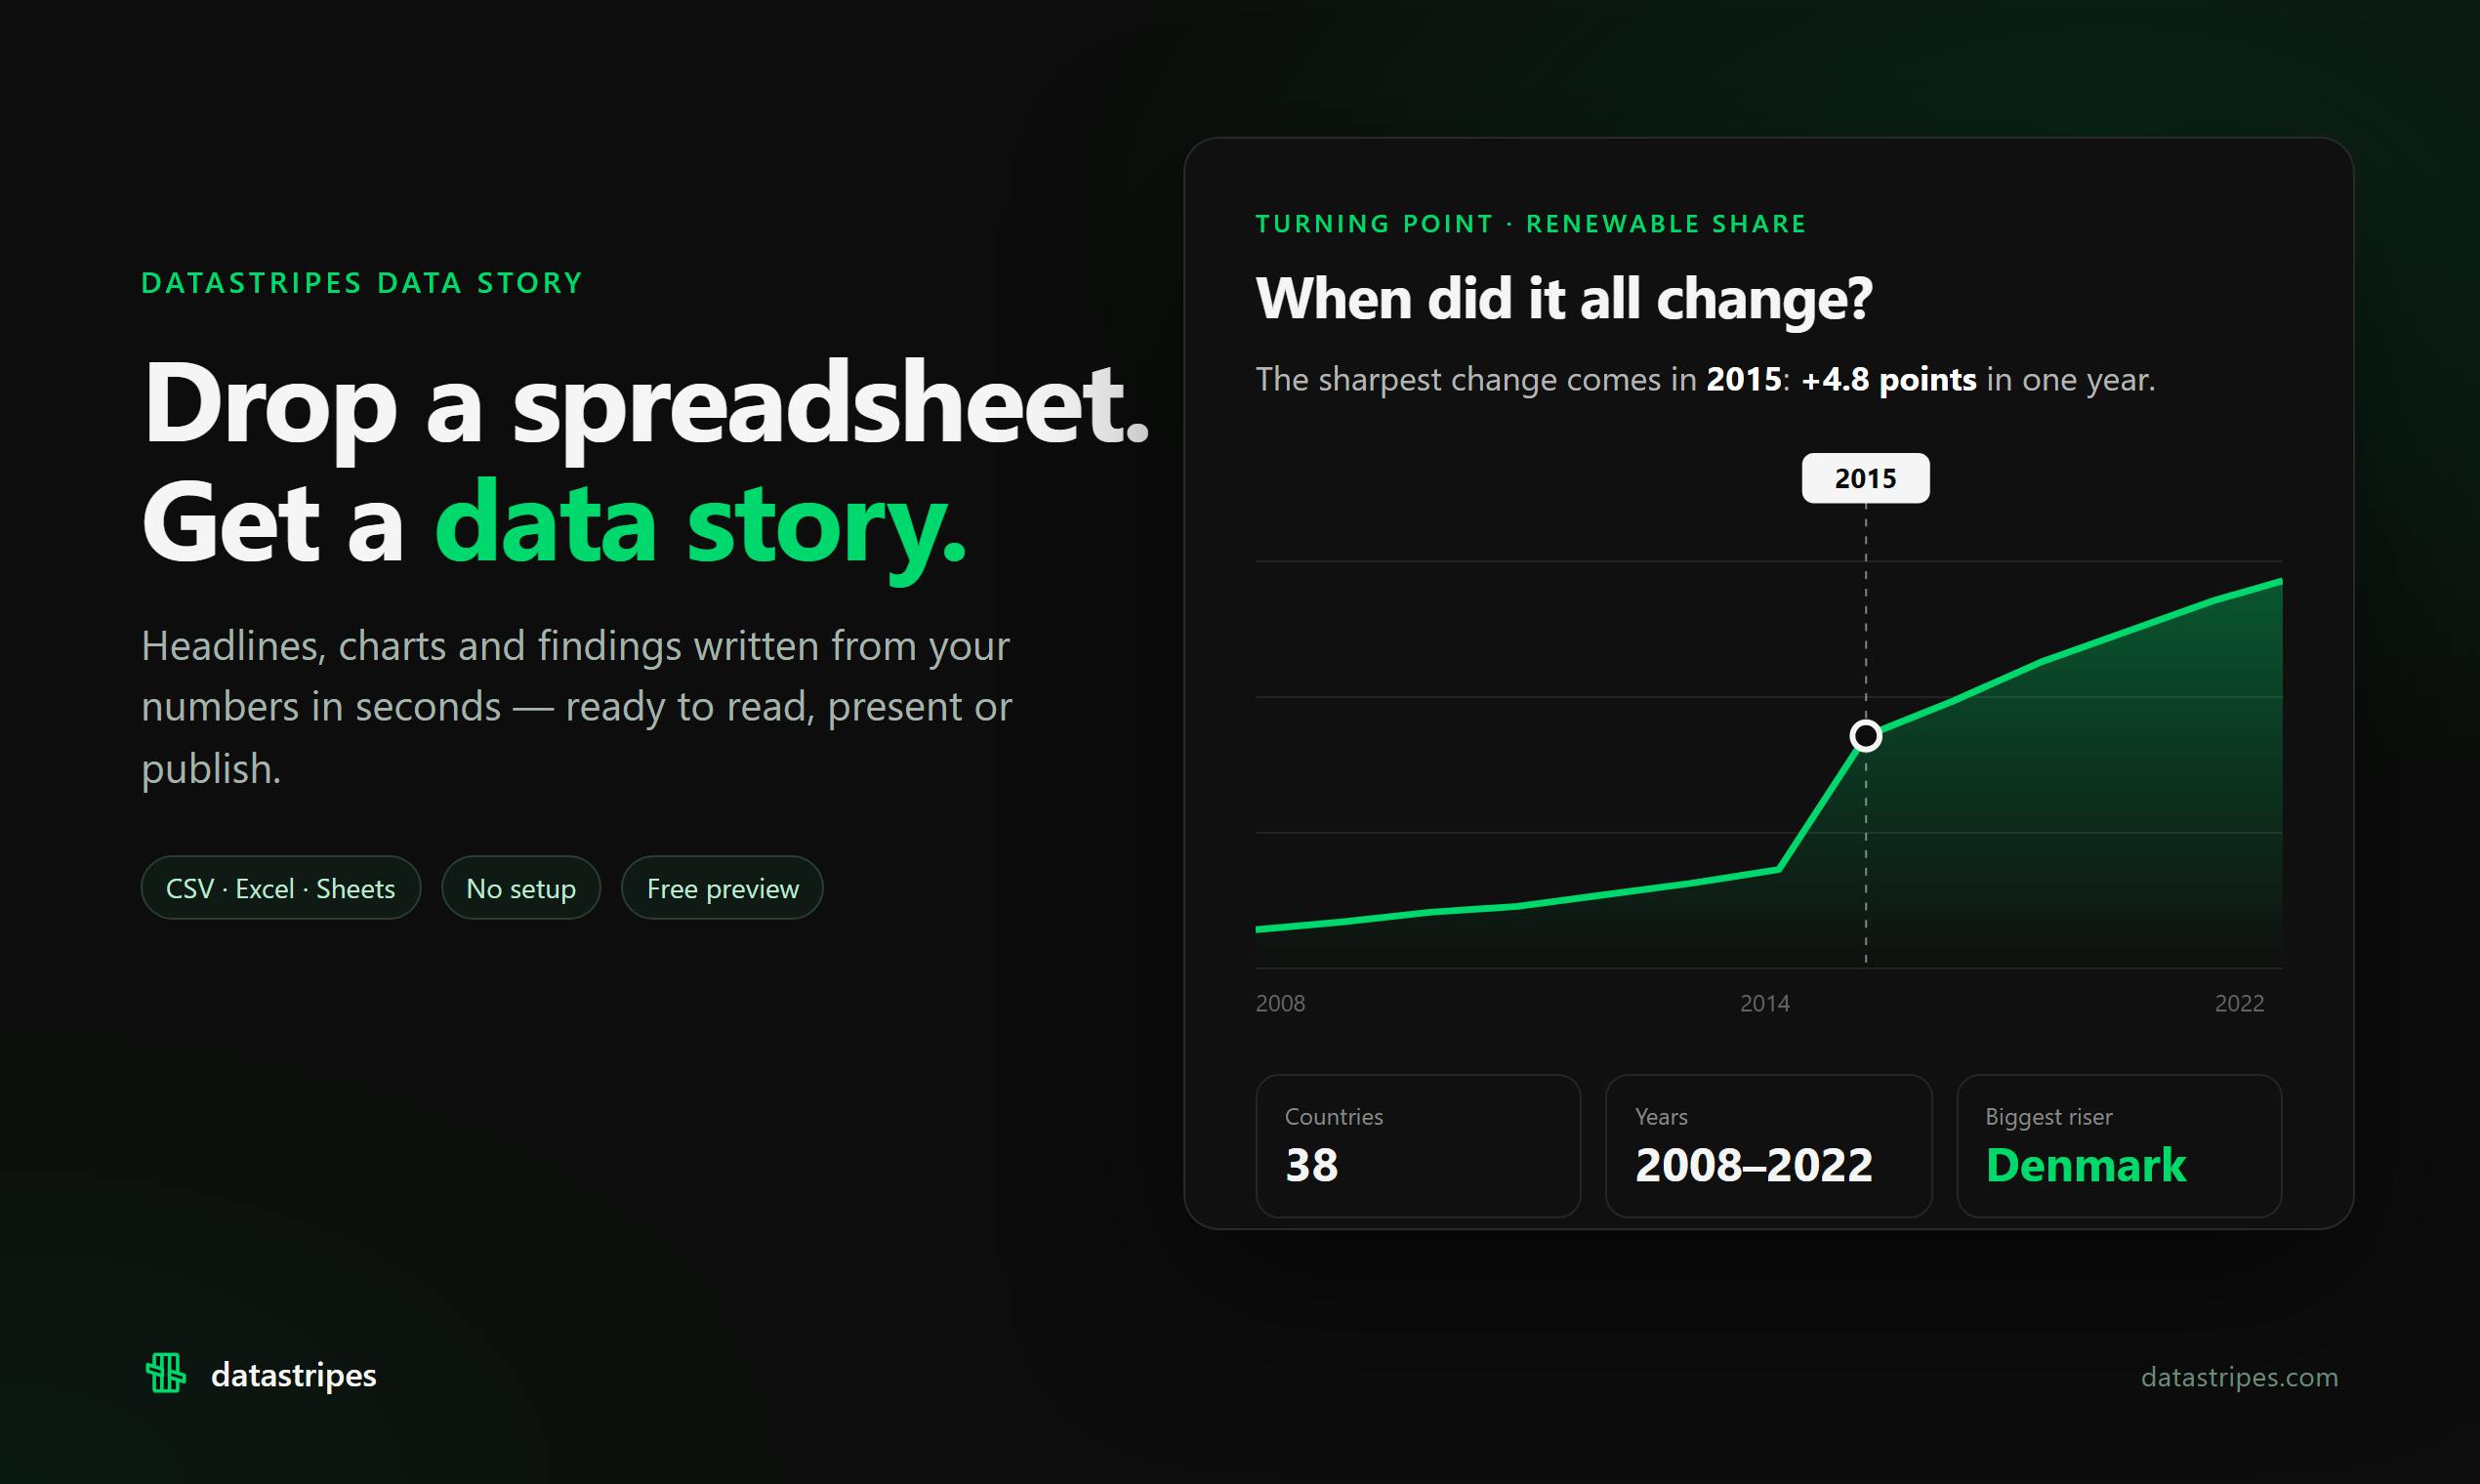
According to the Product Hunt page, the core workflow of Data Stories is: upload a file → choose the question you want to answer → check whether the conclusions match the data → publish in one click. The publishing step supports 8 formats and allows you to apply brand colors. This means the entire process from raw data to externally shareable content can be completed in minutes rather than days.
Automated Data Storytelling: Why Is It Worth Attention Now?
Data visualization tools are plentiful, but most stop at "drawing charts"—you drag fields, and it generates a chart. The truly hard part is distilling actionable conclusions from charts and expressing them in language that non-technical people can understand. Datastripes automates this step, which happens to target the most time-consuming part of the data analysis workflow.
More importantly, there's the "check your conclusions" step. Automatically generated stories without verification can easily turn into confidently stated nonsense. Datastripes allows users to verify conclusions against the data before publishing, which to some extent alleviates the credibility problem of AI-generated content. However, this verification is still manual, and whether the product itself has automatic fact-checking capabilities is not evident from the available information.
Judging from Product Hunt feedback, the product received 93 votes, ranked 7th for the day, and has 3 comments. The vote count indicates a certain level of interest, but the low comment count means in-depth user feedback is still limited. For a product that claims to replace the collaboration of an analyst, a designer, and a writer, its real-world performance still needs more user validation.
Data Storytelling is a practice area at the intersection of data analysis and communication studies. Its core premise is that presenting charts alone is insufficient to drive decisions—data insights also need to be embedded in a narrative framework with causal logic and audience awareness. Classic frameworks typically involve three steps: explore the data to find anomalies or trends, determine the narrative angle (who needs to know what in what context), and choose appropriate visual encoding and textual explanation. Unlike "data visualization," which emphasizes graphical accuracy, data storytelling emphasizes the actionability of conclusions and the audience's cognitive cost. Automated data storytelling attempts to replace human effort in these three steps using rule engines or large language models, with typical technical approaches including automated insight detection (e.g., scanning for statistically significant anomalies) and natural language generation (converting statistical results into sentences). This direction has seen sustained academic research since the 2010s, but only became ripe for productization once large models gained long-text organization capabilities.
Who Is Datastripes Best Suited For?
Inferring from the product positioning, the most direct target users of Data Stories are small and medium-sized businesses without dedicated data teams and independent creators. Marketing operations staff need to compile campaign data into weekly reports, consultants need to package research findings into client proposals, and self-media authors need to turn public data into readable visual-text content—in these scenarios, Datastripes' value proposition is quite clear.
However, for large enterprises with strict data governance requirements, or in-depth analytical reports demanding extremely high narrative precision, automatically generated stories may still require manual post-processing. The product's currently demonstrated capabilities focus on "rapid drafting" rather than "deep analysis."
The Boundaries and Challenges of Automated Data Stories
Datastripes' vision is compelling, but automated data storytelling faces several unavoidable difficulties. First, dependence on data quality: garbage in, garbage out—if the source data contains missing values or outliers, automatically generated stories may reach misleading conclusions. Second, the risk of narrative templating: AI-generated stories tend to fall into fixed sentence patterns, and long-term use may cause content to lose its individuality. Third, brand consistency: although brand colors are supported, whether the writing style can match brand tone remains unknown.
According to the Product Hunt page, the product was developed by Vincenzo Manto and is listed under three categories: Writing, Data & Analytics, and Data Visualization. This cross-disciplinary positioning itself shows that data storytelling is a composite task spanning analysis, writing, and design—taking it all on with a single tool is ambitious, and the challenges are equally significant.
Fact-checking and verifiability are key thresholds for automatically generated content to be adopted in serious contexts. In the context of data storytelling, fact-checking involves at least three levels: numerical consistency (whether the numbers cited in the text correspond exactly to the source data), inferential validity (whether causal or correlational statements from data to conclusions over-extrapolate), and contextual completeness (whether key dimensions that would change the conclusion are omitted, such as too small a sample size or an unusual time window). Manual "checking conclusions" typically covers only the first level, because the latter two require domain knowledge and statistical judgment. This is why in regulated industries (finance, healthcare, public communications), automatically generated analytical content is often required to retain a human sign-off step. For tools like Datastripes, whether automatic validation can be embedded in the product (e.g., linking each conclusion sentence back to a specific data slice) will determine whether it can upgrade from a "drafting tool" to a "trusted output tool."
Worth a Try, But Don't Rush to Abandon Your Analyst
Datastripes Data Stories has the right idea: turning data storytelling from a "multi-person collaborative project" into a "single-person few-minute task." If this efficiency gain can truly be realized, the transformation of content production workflows would be significant. The 93 votes and 7th-place ranking for the day show market demand for such tools.
But the core of a data story is not generation speed—it's the reliability of conclusions and the insightfulness of the narrative. With only 3 product comments, we cannot yet judge Datastripes' true performance on these two dimensions. For users who want to try it out, we recommend starting with internal reports or non-critical decision scenarios, verifying the accuracy of generated conclusions before considering broader use.
One-line Summary
Datastripes launches Data Stories: upload a spreadsheet and automatically generate data stories with charts and conclusions, focused on rapid drafting.
Paragraph Summary
Datastripes launched Data Stories on Product Hunt. After users upload a CSV or Excel file and select the question they want to answer, the product automatically generates data stories containing headlines, charts, and conclusions, with support for brand colors and 8 publishing formats—compressing work that traditionally takes an analyst, designer, and writer days of collaboration into a few minutes for a single person. Its target users are small and medium-sized businesses and independent creators lacking dedicated data teams, and its core value lies in automatically distilling actionable conclusions rather than deep analysis. The product received 93 votes on Product Hunt and ranked 7th for the day, but has only 3 comments, so real-world performance remains to be validated; it also faces three major challenges: dependence on data quality, narrative templating, and brand consistency.
Related articles
 Tech Frontiers
Edge AI on Microcontrollers: When Is It Actually Worth Deploying?
Drawing on Reddit discussions and Arm case studies, this article analyzes the real-world use cases for edge AI on microcontrollers: when each device needs independent inference, when a gateway or cloud is more reasonable, and the costs and boundaries of specialized hardware.
 Tech Frontiers
Pushing the Limits of Extreme Sudoku on a 16GB GPU: Insights from Depth and Flow Matching
A researcher trained a 16.54M-parameter model on a 16GB GPU to solve extreme Sudoku, finding effective depth breaks the 60% plateau and flow matching with improved sampling pushes accuracy past 99% with ~50× lower layer-evaluation budget.
 Tech Frontiers
AI Agent Approval Workflows: Why Human Confirmations Always Get Mindlessly Clicked
Why do AI agent approval workflows always get mindlessly clicked? A Reddit discussion shows that separating rules from keys, low-frequency high-risk approvals, and GitHub Environments-style gates are the keys to effective approvals.