How Grafana Cloud Builds Observability for AI Agents

Grafana proposes a four-phase Agent observability framework, from instrumentation to a proactive operations loop.
Based on real-world experience with Grafana Assistant, the article argues that traditional monitoring metrics cannot answer whether an Agent did the right thing. It proposes a four-phase observability framework: use OpenTelemetry GenAI semantic conventions for instrumentation and spot-check conversations for early cost and tool-call insights; use LLM judges to score each conversation online and write scores to Prometheus for alerting and SLOs; turn failed conversations into test cases and run cross-version, cross-model experiments as merge evidence for PRs; and connect Knowledge Graph, Watchers, and investigations to move from passive monitoring to proactive operations.
AI Agents are rapidly moving from experimental projects into production environments, but a fundamental problem continues to plague builders: Agent behavior is like a black box, and traditional monitoring metrics cannot answer the question "did it do the right thing?" In Grafana's Agent Observability product presentation, Product Director Devin and Software Engineer Jack use their own Grafana Assistant experience as a thread to systematically break down a four-phase Agent observability framework.
From "Vibes" to Systems Engineering: Lessons from Grafana Assistant
The two speakers provided a highly persuasive piece of background data: after Grafana Assistant grew from a hackathon project into general availability, it now has more than 18,000 organizations actively using it, with over 100 contributors. The cost of scaling was that early monitoring based on custom dashboards and spreadsheets — the "vibes" approach — completely failed.
One core insight Devin and Jack distilled is straightforward: vibes don't scale. The essential difference between Agents and traditional software is non-determinism — ask the same question a few seconds later and the answer may be completely different; the Agent can autonomously perform multi-step operations, call real systems, and also fail silently. Latency, error rate, and throughput all being green does not mean the Agent is not harming the user experience. They gave a vivid counterexample: customer service is alerting, users are complaining that the chat Agent locked their bank cards, while the traditional telemetry signals in front of the on-call engineer are all serene.
Phase 1: Instrumentation and Spot Checks — Returns Arrive Sooner Than Expected
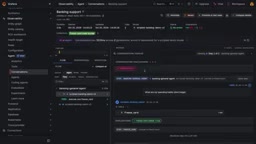
The first phase has the lowest barrier to entry: complete instrumentation using OpenTelemetry's new GenAI semantic conventions, or use the official SDK to integrate mainstream Agent frameworks, and then aggregate the data into a Conversation view. Jack emphasized that instrumentation alone, plus manually flipping through a few conversations, can deliver "surprising" early returns.
These returns include cost visibility — how much money each Agent and each token costs; tool call statistics — which tools are never used and which are frequently relied upon; and establishing a conversation record system for critical scenarios such as finance and healthcare, so that when a user complains about a particular conversation, the scene can be fully replayed.
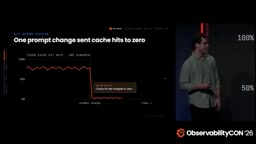
A pitfall Grafana itself encountered is quite representative: after a certain PR, the cache hit rate dropped almost to zero, and token costs surged. Through Agent Observability, they located the problem: a dynamic variable had been introduced at the very top of the system prompt, causing every request to miss the cache. After moving the system prompt later in the conversation, costs dropped significantly. Because the data lands on Grafana Cloud, Agent tool calls can be drilled down directly into the full trace of the underlying backend services, quickly distinguishing whether the problem lies with the Agent itself or with a downstream service failure.
OpenTelemetry's GenAI semantic conventions are a standardized attribute naming specification for generative AI and Agent scenarios, defining how to describe events such as model calls, tool execution, conversations, and token consumption. They give Agent telemetry data from different frameworks and vendors a unified structure, so it can be queried, aggregated, and compared in the same backend. Without this layer of convention, every team would define custom fields, and cross-Agent analysis and alerting would be difficult to reuse. Grafana's official SDK wraps automatic instrumentation for mainstream Agent frameworks on top of these conventions, so developers only need to integrate the SDK to write conversations, tool calls, and model requests into an OpenTelemetry-compatible backend.
Phase 2: Building Quality Signals with LLM Judges
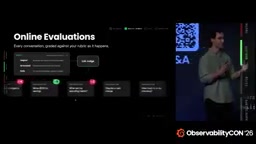
Beyond traditional engineering metrics, dedicated quality signals are needed. Grafana's approach is online evaluations: when each conversation enters the system, an LLM is used as a judge to score it according to preset scoring criteria. For example, evaluate "helpfulness" on a scale of 1 to 10, or use true/false to determine "whether a certain tool was called in this conversation."
These scores are written into Prometheus, so custom dashboards, alerts, and SLOs can be built for helpfulness scores just like for traditional software. In the demo, a "spending advice" type question triggered the Agent's tool call to freeze a bank card; the judge immediately captured that the freeze card call was true and routed such conversations into a dedicated collection for human review. Jack demonstrated creating helpfulness scores and tool routing rules directly in natural language with Grafana Assistant, showing how flexibly judges can be configured.
LLM-as-a-judge refers to using one language model to score or classify another model's output or an entire conversation according to preset scoring criteria. It is suitable for evaluating dimensions that are hard to express with rules, such as helpfulness, whether the tone is appropriate, and whether a certain business process was followed. In practice, it usually requires a clear scoring rubric and a few examples to reduce the randomness of judging, along with periodic human annotation to calibrate the judge's own accuracy. Because judging results are structured values or labels, they can be written directly as metrics into a time-series database, thereby reusing existing operational tools such as alerting, SLOs, and dashboards.
Phase 3: CI/CD for Agents
With quality signals in place, the next step is to turn failure cases into test cases and prove before release that a change is effective. In the demo, colleague Stephanie submitted a PR: modifying the system prompt, adding an approval step to the card-freezing tool, and adding a test case stating "the bank should not freeze cards without reason." Through an experiment comparing versions, the old version fabricated a "health lock policy," while the new version politely gave advice and had a clearly higher pass rate. Such experiment data can serve directly as merge evidence for the PR.
The same mechanism also applies to model migration: faced with model deprecation, you can have the Agent run the same set of tests on different models such as Haiku, Sonnet, and Opus, weighing quality, cost, and latency. More critical is the closed-loop capability — when you find a bad conversation in the conversation view, you can promote it to a test case with one click to prevent regressions.
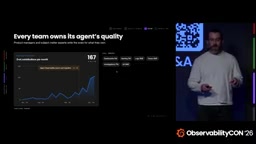
Devin added an unexpected organizational benefit: this tooling led product managers inside Grafana to start writing evaluations themselves. The dashboards team, as experts in that domain, can now define what a "good Agent output" is, which brings quality standards closer to real usage scenarios.
An experiment is a core method in Agent evaluation: the same set of input samples is given to both a baseline version and a candidate version, and then metrics such as pass rate, cost, and latency are compared. Unlike unit tests, Agent outputs are non-deterministic, and a single run is not enough to draw conclusions, so multiple rounds of sampling and statistical comparison of results are usually required. Attaching experiment conclusions directly to the PR means that every prompt modification, tool change, or model migration must pass review with quantifiable evidence, turning "vibes"-based changes into engineering decisions that can be rolled back and traced.
Phase 4: Bringing Agents into the Overall Operations System
The final phase is connecting Agent Observability with other Grafana Cloud capabilities. Agent data is written into the Knowledge Graph, so you can quickly jump from an Agent tool call error to the real backend service. Watchers can monitor Agents and, after triggering an alert, automatically launch an investigation; combined with managed sandboxes, engineers may wake up in the morning to find a PR waiting for review.
Even if a team does not build Agents, it is very likely "using Agents." Grafana provides a dedicated view for coding Agents: spending by team, cost by feature branch, built-in PII redaction, MCP and tool usage statistics, and out-of-the-box support for mainstream coding Agents. There is also an open-source local version that gives developers visibility into local coding workflows, along with a security guardrail package — for example, preventing Agents from reading .env files to avoid leaking secrets.
The Knowledge Graph is a graph layer in Grafana Cloud for describing entities and their relationships. It organizes objects such as services, alerts, conversations, and tool calls, as well as the dependencies between them. With this layer of association, engineers can start from a failed Agent tool call and quickly locate, along edge relationships, the downstream service that actually handled the request, along with related alerts and change records, without manually piecing together clues across multiple dashboards. This is precisely the underlying mechanism that, beyond traditional observability, connects Agent telemetry with existing operational data.
Four-Phase Framework at a Glance
- Instrumentation and spot checks: OpenTelemetry integration, conversation view replay, cost and tool usage visibility;
- Quality signals: online scoring by LLM judges, integrated with Prometheus for alerting and SLOs;
- CI/CD: failed conversations turned into test cases, cross-version and cross-model comparative experiments;
- Agentic operations: integration with Watchers, investigations, and Pages, shifting from passive monitoring to proactive operations.
The closing point from the two speakers is worth remembering: traditional observability answers "is the system running," while Agent observability must answer "is the system doing the right thing." The former relies on metrics; the latter requires linking evaluation, experimentation, and operations into a complete chain.
Related articles
 Tech Frontiers
Sherlock: An Open-Source Tool for Tracking Usernames Across Social Networks
Sherlock is an open-source Python tool that tracks social accounts across networks by username. This article covers its core features, why developers love it, typical use cases, and privacy compliance considerations.
 Tech Frontiers
GitHub Daily·Nov 07: Agent-Ready and Context Compression
GitHub Trending Nov 07: meta's agent-ready design system astryx, billion-context's 5x context compression, sherlock nearing 100k stars, plus local-first localthings and bare-metal GPU orchestration nvke.
 Tech Frontiers
Buoyant Open-Sources Kinference: An Inference Control Plane for vLLM on K8s
Buoyant open-sources Kinference, an inference control plane for vLLM on Kubernetes, with declarative routing, KV-cache-aware load balancing, and per-tenant metrics—claiming 95% lower median TTFT in official benchmarks.