Vercel Daemons Now Supports OpenTelemetry Tracing: Backend Task Observability Upgrade
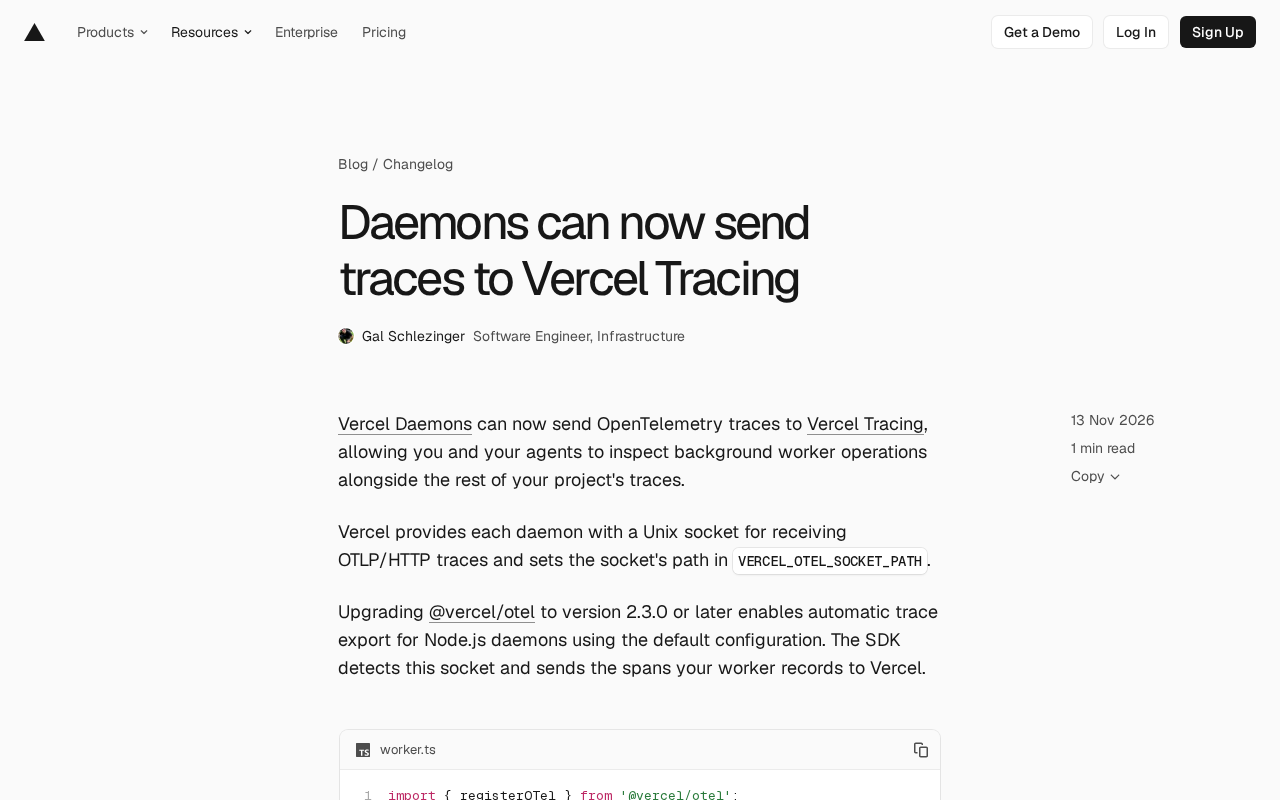
Vercel Daemons now supports sending OpenTelemetry traces to Vercel Tracing, closing the observability gap for background tasks.
Vercel has announced that the Daemons feature now supports sending OpenTelemetry trace data to Vercel Tracing, allowing developers and their AI agents to inspect background workers just like other parts of a project. Vercel provides each daemon with a Unix socket to receive OTLP/HTTP data, with the path set via the VERCEL_OTEL_SOCKET_PATH environment variable to avoid exposing network ports. Upgrading @vercel/otel to 2.3.0+ and calling registerOTel before the worker starts enables automatic trace export. These spans can also be retrieved in JSON via the Vercel CLI for AI agents. The update fills a long-standing monitoring blind spot, linking worker call chains with frontend requests into a complete view.
Vercel has announced that its Daemons feature now supports sending OpenTelemetry trace data to Vercel Tracing. This means developers and their AI agents can inspect the behavior of background workers just like they view traces for other parts of a project. For applications that rely on background tasks to handle asynchronous logic, this fills a critical observability gap.
Backend task observability is no longer missing
In distributed systems, background workers often handle time-consuming tasks, queue processing, and asynchronous computation. However, the execution details of these tasks have long been a monitoring blind spot—traditional tracing tools mainly focus on HTTP request paths and lack visibility into the internal behavior of background processes. By bringing Daemons into the Tracing system, Vercel now lets developers correlate background worker spans with frontend request traces, forming a complete view of the call chain.
According to the official documentation, Vercel provides each daemon with a Unix socket to receive trace data in OTLP/HTTP format, and sets the socket path in the environment variable VERCEL_OTEL_SOCKET_PATH. This design avoids exposing network ports while maintaining compatibility with the OpenTelemetry standard.
A brief overview of OpenTelemetry and OTLP
OpenTelemetry (OTel) is an open-source observability framework under CNCF that provides unified APIs, SDKs, and protocols for generating, collecting, and exporting traces, metrics, and logs. Its core value lies in vendor neutrality: an application only needs to be instrumented once, and the data can be sent to any compatible backend.
OTLP (OpenTelemetry Protocol) is the data transport protocol defined by OTel, supporting both gRPC and HTTP transports. OTLP/HTTP refers to carrying protobuf- or JSON-encoded telemetry data over HTTP requests. The Unix socket mentioned in the article is a transport carrier for OTLP/HTTP—data does not pass through the TCP network stack but instead travels via local inter-process communication, which avoids expanding the security surface from exposed ports and reduces network overhead. Understanding this makes it clear why Vercel chose to expose the socket path via an environment variable rather than opening a listening port.
Automatic export after upgrading the SDK
Enabling this feature is quite straightforward. Developers only need to upgrade @vercel/otel to version 2.3.0 or higher, and Node.js daemons will automatically export trace data when using the default configuration. The SDK detects the aforementioned Unix socket and sends the spans recorded by the worker to Vercel.
At the code level, OpenTelemetry needs to be initialized before the worker starts:
import { registerOTel } from '@vercel/otel';

registerOTel({ serviceName: 'my-daemon' });
This code registers OTel and specifies the service name, which can later be used to filter and search trace data. The official documentation emphasizes that initialization must happen before the worker starts; otherwise, some spans may not be collected correctly.
registerOTel and span collection timing
registerOTel provided by @vercel/otel is an initialization entry point that registers a global TracerProvider within the process and configures an exporter to send spans to Vercel's collector. A span is the basic unit of tracing, representing an operation along with its duration, attributes, and parent-child relationships; multiple spans linked together form a trace, reconstructing the complete call chain of a request or task.
Initialization must be completed before the worker starts because OTel's automatic instrumentation relies on intercepting module loading. If business code loads before the SDK, the relevant modules have already been instantiated and interception cannot take effect, causing those spans to be lost. In practice, registerOTel is usually placed in a separate file and preloaded via the --require or --import parameter to ensure it executes before any business module.
Deep integration with AI agent workflows
One noteworthy detail is that these spans are not only available for human developers to view, but can also be returned in JSON format via the Vercel CLI for AI agents to consume. For example:
vercel traces search --project my-project --service my-daemon --json
This command can search daemon spans from the past hour and output them as JSON. Vercel explicitly mentions in its announcement that this allows "you and your agents" to inspect the operations of background workers. Exposing observability data in a structured format for automation tools aligns with the current trend of AI-assisted operations and automated diagnostics—agents can read trace data, locate anomalous spans, and even trigger remediation workflows.
Why JSON output matters for AI agents
AI agents rely on structured input to process information: they can parse JSON fields, filter by conditions, and chain multi-step reasoning, but they struggle to reliably understand human-readable tables or graphical interfaces. The --json output of the Vercel CLI converts trace data into machine-readable arrays, where each element contains fields such as span name, service name, timestamp, duration, status code, and attributes. Agents can use this to perform operations such as "find spans exceeding a duration threshold" or "calculate the error rate of a service," and feed the results back to developers or trigger subsequent actions.
This also explains why observability tools have increasingly strengthened their CLI and API capabilities in recent years—in automated diagnostic scenarios, whether data can be consumed by programs is often more critical than whether the interface looks good.
Practical significance for developers
From an engineering practice perspective, this update lowers the barrier to debugging background tasks. Previously, troubleshooting performance bottlenecks or errors in workers often required additional log instrumentation or separate monitoring solutions; now, simply following the OpenTelemetry standard is enough to channel data into a unified Tracing dashboard. For teams already using the Vercel ecosystem, the upgrade cost is low, and no third-party APM tools need to be introduced.
However, it is worth noting that the current solution is mainly aimed at Node.js daemons with default configurations. Workers on non-Node.js runtimes or with custom configurations may need to manually adapt the OTLP export logic. In addition, details such as trace data retention policies and query granularity still need to be referenced in the full Vercel Tracing documentation.
Overall, integrating Daemons with Vercel Tracing is a pragmatic infrastructure enhancement that moves background tasks from a "black box" to observable, and also provides the data foundation for AI agents to participate in operations.
One-line Summary
Vercel Daemons now supports sending OpenTelemetry traces to Vercel Tracing, closing the observability gap for background tasks.
Paragraph Summary
Vercel has announced that the Daemons feature now supports sending OpenTelemetry trace data to Vercel Tracing, allowing developers and their AI agents to inspect the behavior of background workers just like other parts of a project. Vercel provides each daemon with a Unix socket to receive OTLP/HTTP data, with the path set via the VERCEL_OTEL_SOCKET_PATH environment variable to avoid exposing network ports. Developers only need to upgrade @vercel/otel to 2.3.0 or higher and call registerOTel before the worker starts to enable automatic trace export. These spans can also be retrieved in JSON format via the Vercel CLI for AI agents to consume, with support for searching by service name. This update fills a long-standing monitoring blind spot for background tasks, correlating worker call chains with frontend requests to form a complete view.
Related articles

Why Microsoft CEO Nadella Still Backs Nvidia After Jensen Huang's Departure
Microsoft CEO Nadella publicly expresses confidence in Nvidia interim CEO Colette Kress. This article analyzes Nvidia's power transition after Jensen Huang's departure, Microsoft's compute dependency, and the trust logic of the AI supply chain.

Nadella: Critical Infrastructure Is 'Unpatchable' as AI Cybersecurity Arms Race Escalates
Microsoft CEO Nadella addresses AI cyberattack fears, saying much critical infrastructure is unpatchable, downplaying the Outlook outage, and analyzing AI's dual role in cybersecurity.

Musk Backs Jensen Huang: Firing Him Is Like Cutting Jordan
Musk says Jensen Huang is loyal to the U.S. and likens firing him to cutting Michael Jordan—highlighting politicization anxieties in the AI chip industry and defending talent value.