Visually Deconstructing Reinforcement Learning: An Intuitive Guide to Core Concepts
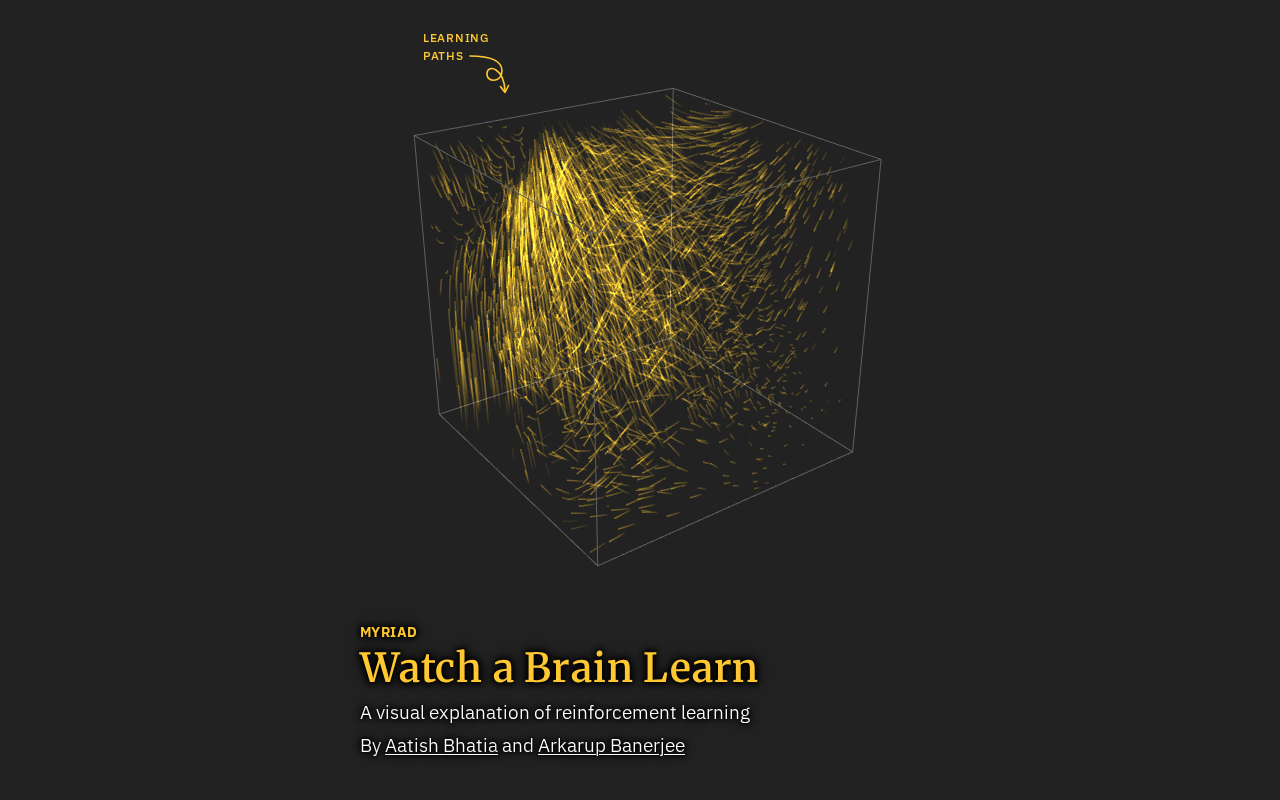
Visual explanations help build RL intuition, but must be paired with math and code for depth.
The article discusses a Hacker News share titled *A visual explanation of reinforcement learning*, noting that RL is hard to approach due to dense terminology and dynamic processes, and that visualization reduces cognitive load via state transition diagrams, reward curves, and policy heatmaps. It covers the core RL loop—agent observes state, chooses action, receives reward, updates policy—and explains three key concepts: policy, value function, and the exploration-exploitation trade-off. It stresses that visualization is only a first stop and cannot replace math or coding practice; its value lies in making abstract mechanisms "visible."
Reinforcement Learning (RL) is often regarded as one of the hardest areas in machine learning to get started with—terms like rewards, policies, value functions, and exploration vs. exploitation pile up, and it's easy to get lost in mathematical formulas. A recent share on Hacker News titled A visual explanation of reinforcement learning attempts to bypass formulas with a visual approach, helping readers build an intuitive understanding of how reinforcement learning works.
Why Reinforcement Learning Needs "Visualization"
Supervised learning has clear labels, unsupervised learning has clear data structures, but the core of reinforcement learning is a process in which an agent continuously tries and errs in an environment, adjusting its behavior based on reward signals. This process is dynamic and cyclical, and pure text descriptions easily lose the causal relationships along the time dimension.
Visualization fills exactly this gap: state transition diagrams show how the environment responds to actions, line charts present the cumulative change of rewards over time, and policy diagrams illustrate how the agent chooses actions in different states. Based on the discussion atmosphere of that Hacker News post, the value of this kind of visual explanation lies in lowering the entry barrier—letting readers first form an intuition of "what this is" before going back to grapple with theoretical details.
The Core Loop of Reinforcement Learning: Agent, Environment, and Reward
The basic framework of reinforcement learning can be summarized as a closed loop: the agent observes the current state of the environment, chooses an action, and the environment transitions to a new state accordingly and returns a reward. The agent adjusts its policy based on the reward and enters the next cycle.
This loop seems simple, but the difficulty lies in the fact that rewards are often delayed—the agent may need to take many steps before knowing whether an early decision was good or bad. Visual explanations typically use a grid world or a simple game to demonstrate this: the reward at each step may be zero until the agent reaches the goal and receives positive or negative feedback, thereby intuitively presenting the essence of the "credit assignment" problem.
Markov Decision Process (MDP) is the most commonly used mathematical framework for reinforcement learning problems. It formalizes the interaction between the agent and the environment as a five-tuple: a set of states, a set of actions, state transition probabilities, a reward function, and a discount factor. The core assumption of MDP is the "Markov property"—the next state depends only on the current state and action, and is independent of earlier history. This assumption makes the problem computable and is also the premise for value functions to be defined recursively (the Bellman equation). The grid world commonly seen in visual explanations is essentially an MDP example with a finite state space.
Policy, Value, and Exploration: Three Inescapable Concepts
Policy: The Agent's Behavioral Guideline
A policy is the rule by which the agent selects actions given a state. Visual materials generally use arrow diagrams or heatmaps to show: in a given state, what the probability distribution over actions looks like. Understanding policy is the first key to understanding reinforcement learning, because the ultimate goal of reinforcement learning is to find a policy that maximizes long-term cumulative reward.
The credit assignment problem refers to: when the agent finally receives a reward, how to determine which of the many preceding actions contributed to the outcome and by how much. This is one of the fundamental difficulties that distinguishes reinforcement learning from supervised learning—there is no label telling the agent "this step was correct." Temporal-difference (TD) learning gradually propagates reward signals backward by comparing value estimates of adjacent states, and is the main approach to solving credit assignment; Monte Carlo methods, by contrast, wait until the end of an episode to update, having high variance but low bias. The grid example in visualizations where "the reward appears only at the end after a delay" is precisely an intuitive presentation of the credit assignment problem.
Value Function: Judging "How Good a State Is"
A value function estimates how much cumulative reward can be obtained in the future starting from a certain state. If reward is the immediate feedback, then the value function is the prediction of the future. Visual explanations often use color intensity to mark the value of different states, letting readers see at a glance which positions the agent "thinks" are closer to the goal.
The Bellman equation is the core recursive relationship behind value functions: the value of a state equals the immediate reward plus the discounted expected value of the next state. The discount factor (usually denoted γ, ranging from 0 to 1) determines how much the agent values future rewards—the closer γ is to 1, the more "far-sighted" the agent is; the smaller γ is, the more short-sighted it becomes. This equation is important because it transforms "future cumulative reward," a quantity that seems to require infinitely many steps of forward expansion, into a recursive form that can be gradually approximated using dynamic programming or temporal-difference methods. Almost all reinforcement learning algorithms are built upon it.
Exploration vs. Exploitation: A Dilemma
If the agent always chooses the action that currently looks best, it may miss better paths; if it keeps trying new actions, it may waste a lot of time. Balancing exploration and exploitation is a classic challenge in reinforcement learning. Visualizations typically compare two curves: one representing the long-term benefit of continuous exploration, and the other representing the short-term stability of pure exploitation, intuitively presenting the trade-off.
The ε-greedy strategy is the simplest and most commonly used method for handling the exploration-exploitation trade-off: with probability ε, randomly choose an action (exploration); with probability 1-ε, choose the action with the highest current estimated value (exploitation). ε is usually set to a small value (such as 0.1), and can also decay over time, allowing the agent to explore more early on and exploit more later. More refined methods include optimism-based exploration under uncertainty (such as UCB) and soft policies based on probability distributions (such as Softmax). Understanding this mechanism helps bring the "dilemma" from an abstract concept down to the level of operable algorithms.
The Boundaries and Value of Visual Explanations
The share from Hacker News itself contains limited information, and there was no extended discussion under the post, but based on its positioning, it belongs to introductory popular-science material. The advantage of visualization lies in building intuition, but it cannot replace mastery of mathematical derivations and algorithmic details. For readers who wish to delve deeper into reinforcement learning, visual explanations are better suited as a first stop; afterward, they still need to combine textbooks and hands-on coding.
What is commendable is that this kind of content makes reinforcement learning no longer a pile of symbols in papers, but a process that can be "seen." For educational scenarios and cross-disciplinary readers, this attempt to reduce cognitive load has practical significance.
One-line Summary
Visual explanations help build reinforcement learning intuition, but must be combined with math and code for depth.
Paragraph Summary
The article centers on the Hacker News share A visual explanation of reinforcement learning, pointing out that reinforcement learning is hard to get started with due to dense terminology and dynamic processes, and that visualization can reduce cognitive load through state transition diagrams, reward curves, and policy heatmaps. The article outlines the core loop of reinforcement learning—the agent observes states, chooses actions, receives rewards, and updates its policy—and focuses on explaining three key concepts: policy, value function, and the exploration-exploitation trade-off. It also emphasizes that visualization is only suitable as a first stop for beginners and cannot replace mathematical derivation and coding practice; its value lies in making abstract mechanisms "visible."
Related articles

Microsoft Open-Sources Token Economizer: Saving 18%-31% on AI Coding Agent Costs
Microsoft's free open-source plugin Token Economizer cuts AI coding agent costs through micro skills, tool pruning, and failure loop intervention. Tests show 18.4% to about 31% average savings with Claude Code, Codex, and more.
Running GLM-5.3 on Two DGX Stations: A vLLM Tensor Parallelism Hands-On
NVIDIA engineers show how to run the 753B-parameter GLM-5.3 locally on two DGX Stations using vLLM tensor parallelism, covering RDMA setup, launch args, NCCL checks, and performance baselines.
97KB Single-File HTML Underwater World: A WebGPU Experiment in AI Programming
A developer used a single prompt in Claude Code to generate a 97 KB single-file HTML underwater world, fully procedurally generated with WebGPU—kelp forests, a shipwreck, and fish, no images or model libraries, MIT-licensed, playable on mobile.