Building an AI Stock Analysis System with Qwen3 + Dify: A Hands-On Tutorial
Build a real-time AI stock analysis system using Qwen3 and Dify workflows for automated trading insights.
This tutorial walks through building an AI-powered stock analysis system combining Dify's visual workflow platform with Alibaba's Qwen3 LLM. The system fetches real-time market data, calculates key technical indicators (RSI, MACD, Bollinger Bands, moving averages), and generates professional trading strategies with entry points, stop-losses, and position management advice across A-share, Hong Kong, and US markets.
Project Overview: An AI-Driven Real-Time Stock Analysis System
In an era where quantitative investing and intelligent trading are becoming increasingly mainstream, building personalized stock analysis tools powered by large language models is now within reach. Quantitative investing originated on Wall Street in the 1970s, driven by mathematical models and computer algorithms for investment decision-making. With the rise of large language models, quantitative investing is undergoing a new wave of transformation: traditional quant strategies rely on predefined mathematical formulas and statistical models, while the introduction of LLMs enables systems to understand unstructured information (such as earnings report text and news sentiment) and output interpretable investment advice in natural language. However, it's important to note that LLM applications in finance are still in the exploratory stage, and any strategy recommendations they produce must undergo rigorous backtesting before being used in live trading.
This article provides a detailed guide on how to build an AI stock analysis system using the Dify workflow platform combined with Qwen3 (Tongyi Qianwen 3) — a system capable of fetching real-time stock data, calculating technical indicators, and generating professional trading strategies.
About the Dify Platform: Dify is an open-source LLM application development platform that provides visual workflow orchestration capabilities, allowing developers to build complex AI applications through drag-and-drop nodes without writing extensive glue code. Dify supports multiple LLM integrations (OpenAI, Anthropic, Chinese domestic models, etc.) and includes built-in node types such as variable management, conditional branching, HTTP requests, and code execution, making it efficient and intuitive to build end-to-end AI workflows.
About Qwen3: Qwen3 is Alibaba Cloud's next-generation large language model, featuring significant improvements in reasoning ability, instruction following, and multilingual understanding. Qwen3 supports hybrid thinking modes (thinking/non-thinking) and can demonstrate stronger logical reasoning chains in complex analytical tasks. Through the Alibaba Cloud Bailian platform, developers can conveniently obtain API Keys and integrate them into various applications. The model supports ultra-long context windows, making it particularly well-suited for financial analysis scenarios involving large volumes of numerical data.
The core capabilities of this system include:
- Real-time retrieval of actual stock trading data
- Automatic calculation of technical indicators including RSI, MACD, and moving averages
- Stock risk assessment and intrinsic value evaluation
- Generation of comprehensive, scientifically-grounded investment strategy recommendations
System Architecture Design
The entire project implementation is divided into two core components:
Dify Workflow (Frontend Orchestration)
The Dify workflow is responsible for receiving user-input stock codes and market type parameters, performing parameter validation, sending requests to the backend server, and ultimately passing the returned data to the Qwen3 model for in-depth analysis.
Custom Server (Backend Data Service)
The server side serves as the data engine of the entire system. It fetches the latest trading data based on stock codes, calculates various technical indicators (trend analysis, RSI, MACD, moving averages, volume, etc.) from this data, and returns the structured analysis data to Dify.

The overall data flow is:
User inputs stock code → Dify parameter validation → HTTP request to Server → Server fetches data and calculates indicators → Returns to Dify → Qwen3 model deep analysis → Outputs investment strategy
Core Technical Indicators Explained
Before diving into the system implementation, it's essential to understand the core technical indicators calculated by the system, as these form the data foundation for AI analysis:
RSI (Relative Strength Index)
RSI (Relative Strength Index) is a momentum oscillator proposed by J. Welles Wilder in 1978, used to measure the speed and magnitude of stock price movements. RSI ranges from 0 to 100, typically calculated over a 14-trading-day period. When RSI exceeds 70, the stock is considered overbought and may face pullback pressure; when RSI falls below 30, it's considered oversold and may present a rebound opportunity. RSI can also predict trend reversals through divergence signals (price makes a new high but RSI does not).
MACD (Moving Average Convergence Divergence)
MACD (Moving Average Convergence Divergence) is a trend-following momentum indicator proposed by Gerald Appel in the late 1970s. It consists of three core components: the MACD line (the difference between the 12-day EMA and 26-day EMA), the signal line (the 9-day EMA of the MACD line), and the histogram (the difference between the MACD line and signal line). When the MACD line crosses above the signal line, it forms a "golden cross," typically viewed as a buy signal; when it crosses below, it forms a "death cross," viewed as a sell signal. MACD's advantage lies in simultaneously capturing trend direction and momentum changes, making it one of the most widely used indicators in technical analysis.
Moving Averages (MA)
Moving Average is one of the most fundamental and important tools in technical analysis. It smooths price fluctuations and identifies trend direction by calculating the arithmetic mean of closing prices over a given period. Common periods include 5-day (weekly), 10-day, 20-day (monthly), 60-day (quarterly), and 250-day (annual). Moving averages are divided into Simple Moving Averages (SMA) and Exponential Moving Averages (EMA), with the latter assigning higher weight to recent prices and being more sensitive to trend changes. The alignment patterns of multiple moving averages (such as bullish alignment and bearish alignment) and crossover signals (golden cross, death cross) are important bases for judging market trends.
Bollinger Bands
Bollinger Bands were proposed by John Bollinger in the 1980s and consist of three lines: the middle band is an N-day simple moving average (typically 20 days), while the upper and lower bands are the middle band plus or minus K times the standard deviation (typically K=2). The core concept of Bollinger Bands is using standard deviation from statistics to measure price volatility — when volatility increases, the bandwidth expands; when volatility decreases, the bandwidth narrows. Price touching or breaking through the upper band typically indicates short-term overbought conditions, while touching the lower band indicates oversold conditions. A Bollinger Band squeeze often signals an impending significant price movement.
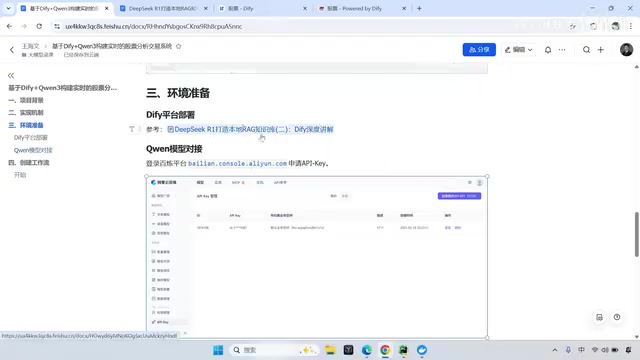
Environment Preparation and Deployment
Building this AI stock analysis system requires three foundational environments:
- Dify Platform: Download the code from GitHub and deploy via Docker — the process is relatively straightforward
- Qwen3 Model API: Log in to the Alibaba Cloud Bailian platform to obtain an API Key, then configure model access in Dify
- Custom Server: Running on local port 8080, providing interfaces for stock data retrieval and technical indicator calculation
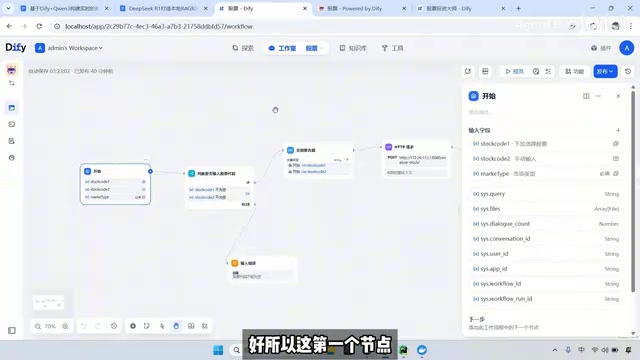
Detailed Dify Workflow Construction
Start Node: User Input Design
The start node needs to support three input fields:
- Dropdown stock selection: Preset commonly used stock codes for quick selection
- Manual stock code input: Supports free input of any code
- Market type (type): Distinguishes between A-shares, Hong Kong stocks, and US stocks
Conditional Branch: Parameter Validation Logic
Since stock codes can be entered in two ways (dropdown and manual), and neither is required, a conditional branch node is needed to ensure at least one is not empty. OR logic is used here: as long as either code1 or code2 is not empty, validation passes; otherwise, it returns an error message stating "Stock code cannot be empty."
Variable Aggregation and HTTP Request Configuration
A variable aggregator extracts the valid stock code and passes it to the HTTP request node. Key configuration for the HTTP request node:
- Request method: POST
- Request URL:
http://172.26.112.1:8080/api/stock(local server address) - Header: Content-Type set to application/json, plus API Key authentication
- Body: Contains stock code and market type as two parameters
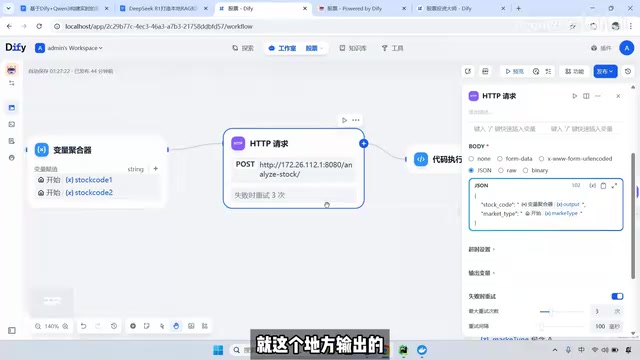
Data Processing and Qwen3 Model Analysis
The data returned by the server is in string format and needs to be converted to a dictionary using json.loads in a code node. Then, based on market type (A-shares/Hong Kong/US stocks), the data is routed to the corresponding LLM analysis node.
Taking A-shares as an example, the Qwen3 model's System Prompt is set to an "A-share Investment Master" role, requiring analysis across the following dimensions:
- Trend analysis (support and resistance levels)
- Volume analysis and interpretation
- Risk assessment
- Short-term and medium-term target prices
- Key technical indicator interpretation
- Specific trading recommendations (entry strategy, stop-loss levels, position management)
Live Results Demonstration
Using 002235 (Annie Shares) as an example, the system produced highly detailed analysis results:
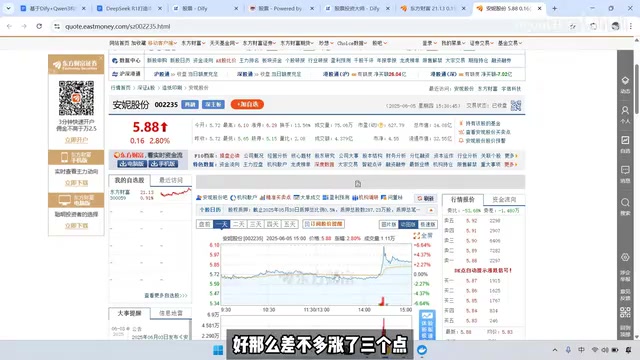
Trend Analysis Results
The system identified that the stock price had broken above the upper Bollinger Band, indicating a short-term strong uptrend. Support levels were precisely located at 5.5 yuan (strong support, June 3 low) and 5.65 yuan (weak support, June 4 low), with resistance at 6.10 yuan (intraday high). Combined with the earlier explanation of Bollinger Bands, a price breakout above the upper band means the stock is at a statistically extreme high — while short-term momentum is strong, it also implies accumulating pullback risk. This is precisely why the system provides both aggressive and conservative strategies.
Trading Strategy Output
The system generated two entry strategies:
- Aggressive: Enter directly at 5.88 yuan, stop-loss at 5.5 yuan
- Conservative: Wait for a pullback to the 5.44-5.50 support zone before entering
Position management recommends an initial position no larger than 1/3, with additional positions added after breaking 6.10. Clear stop-loss levels (5.3 yuan) and position reduction conditions (no new highs for three consecutive trading days) are also defined. This layered position-building and strict stop-loss strategy design reflects the core principle of risk management priority in professional quantitative trading — in uncertain markets, controlling downside risk is often more important than pursuing upside gains.
Technical Key Points Summary
Server-Side Core Logic
Although the server-side code is substantial in volume, it essentially performs two core functions: fetching real-time stock data via GET requests, then calculating technical indicators (RSI, MACD, Bollinger Bands, moving averages, volume analysis, etc.). Once calculations are complete, the results are exposed to Dify via an API interface. It's worth noting that technical indicator calculations require sufficiently long historical data windows — for example, calculating a 250-day moving average requires at least 250 trading days of data, and the MACD signal line requires a 9-day EMA calculated on top of the MACD line. Therefore, the server must retrieve adequate historical data to ensure the accuracy of all indicator calculations.
Workflow Design Philosophy
The overall Dify workflow design reflects sound engineering practices:
- Input validation prevents null values
- Variable aggregation handles multiple entry points
- Conditional branching supports multiple markets
- LLM role configuration ensures output quality
This modular design makes the system easy to extend and maintain. For example, adding new market types (such as Japanese or European stocks) in the future simply requires adding new paths in the conditional branch and configuring corresponding System Prompts. Similarly, if fundamental analysis data (such as P/E ratios or revenue growth rates) needs to be incorporated, you only need to add the corresponding data retrieval and calculation modules on the server side — the overall workflow structure requires no major adjustments.
Important Notes
- This system serves only as an auxiliary analysis tool; investment decisions should incorporate personal judgment
- The server requires a stable stock data source to ensure data timeliness and accuracy
- API Keys should be properly secured; configuration via environment variables is recommended
- Technical indicator calculation logic may differ across markets (A-shares/Hong Kong/US stocks) and should be handled separately
Key Takeaways
Related articles
Deep Dive into Cursor Refill Plugins: Pay-Per-Use Billing and Account Pool Scheduling Mechanisms
Deep analysis of Cursor refill plugin architecture: how clean account pool scheduling replaces cracking tools, the business logic of 35% pay-per-use pricing, and compliance risks developers should consider.

Ubisoft Co-Founder Claude Guillemot Dies in Plane Crash at Age 69
Ubisoft co-founder Claude Guillemot has died in a plane crash at age 69. He co-founded Ubisoft with his four brothers, creating iconic IPs like Assassin's Creed and Far Cry.

How to Write Prompts: Four Elements, Three Techniques, and Three Pitfalls Explained
Master prompt writing with the four-element framework (Role, Task, Requirements, Format), three techniques (few-shot, chain-of-thought, anti-hallucination), and avoid three common pitfalls for better AI results.