Claude Code Monitor Tool Explained: Event-Driven Replaces Polling, Saving Tokens More Efficiently
Claude Code Monitor Tool Explained: Ev…
Claude Code introduces an event-driven Monitor tool, replacing polling for zero-cost background monitoring.
Claude Code's new Monitor tool uses an event-driven mechanism to run processes in the background and notify the main session only when specific conditions (like errors or warnings) are matched through filters, dramatically reducing token consumption compared to traditional polling. It supports two modes — Stream Filter (real-time log filtering) and Poll and Diff (polling difference detection) — suitable for dev server monitoring, real-time test feedback, production deployment monitoring, and more.
What is the Monitor Tool?
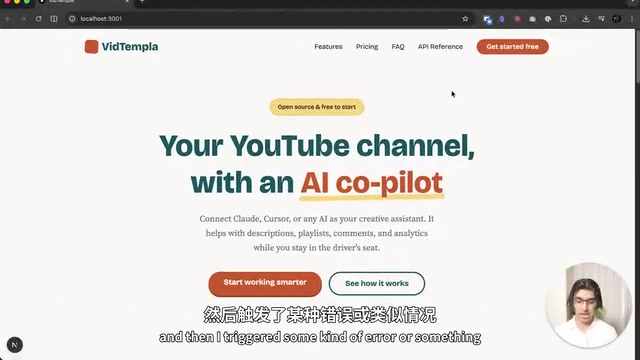
Claude Code recently introduced a brand-new built-in tool — the Monitor Tool — which enables real-time event streaming from background processes. In simple terms, Monitor allows you to run a process in the background, and only when events you care about occur does it pass information back to Claude Code's main session, dramatically reducing unnecessary token consumption.
Think of it as a security camera that only alerts you when it detects motion — running silently most of the time, notifying you only when something happens.
The introduction of the Monitor tool marks an important step in Claude Code's evolution from a "single-turn conversational assistant" to a continuously running development agent (Autonomous Agent). In the AI Agent space, the ability to continuously perceive environmental changes and respond accordingly is key to achieving true autonomy — Claude Code is no longer just passively answering questions, but can actively listen to system states and intervene at critical moments.
Monitor vs Foreground/Background Commands vs Slash Loop
Limitations of Traditional Approaches
Before Monitor appeared, there were several ways to run commands in Claude Code, each with its own shortcomings:
Foreground Commands: For example, when running tests, the command occupies the foreground, preventing you from entering other instructions simultaneously — subsequent commands can only queue up and wait.
Background Commands: Commands run in the background, but the main session is only notified after the command completely exits. For instance, running 47 tests means you have to wait for all tests to finish before knowing which ones failed — even if the 2nd test already failed, you still have to wait until the end.
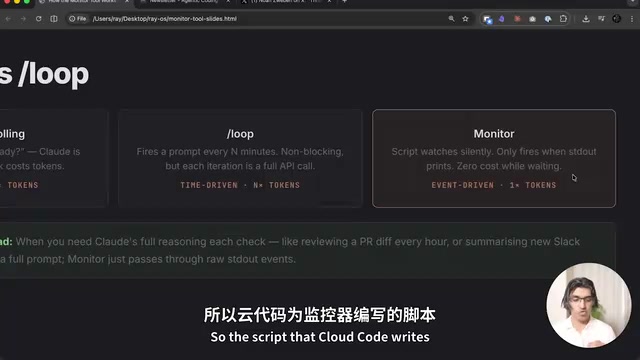
Slash Loop (/loop): This is a time-driven approach that triggers a full API call every n minutes. For example, checking the dev server every 2 minutes — each check is a complete API call, and the token consumption is non-trivial.
Token Economics 101: Tokens are the basic unit of billing and computation for large language models. Typically, 1 token corresponds to approximately 0.75 English words or 1.5 Chinese characters. Each API call consumes input tokens (context) and output tokens (response), with costs growing linearly with call frequency. For long-running development tasks, traditional polling generates a large number of "wasted" API calls — even when the system state hasn't changed at all, each poll still requires sending complete context information, potentially causing over 90% token waste in low-event-frequency scenarios.
Monitor's Core Advantages
Monitor is event-driven. It runs scripts in the background, and only events matching filter conditions are passed back to the main session. This means:
- Near-zero cost when no events are triggered
- Events are delivered in real-time, no need to wait for the command to finish
- No periodic polling needed, avoiding meaningless token consumption
This design philosophy is directly aligned with the mature Event-Driven Architecture (EDA) in software engineering. The core principle of EDA is: components don't actively query state, but passively wait for event notifications. From the Linux kernel's epoll mechanism, Node.js's event loop, to Kafka message queues and Webhook callbacks, EDA is ubiquitous in modern systems. The Monitor tool brings this paradigm to AI programming assistants, essentially transforming Claude Code from a "periodic poller" into an "event subscriber."
How Monitor Works
The Monitor tool has four core parameters:
- Description: Defines what you want to monitor
- Command: The actual shell command to execute
- Filter: Defines which output lines count as "events" (keywords like error, warn, failed, ready, etc.)
- Timeout & Persistent: Controls the monitor's lifecycle
The workflow goes like this: You describe what you want to monitor → Claude Code writes a command with the correct filters → The command only produces output when matching events occur → Each output is treated as a notification event → Claude Code responds accordingly.
Monitor's Filter mechanism is essentially an application of the Unix Pipeline philosophy. In Unix/Linux systems, programs communicate through standard input/output (stdin/stdout/stderr), and tools like grep, awk, and sed can filter and transform text streams in real-time. Monitor's filtering operations are performed entirely locally without any network requests, ensuring real-time performance and zero additional latency — only filtered "hits" trigger calls to the Claude API.
Two Monitoring Modes Explained
Stream Filter Mode
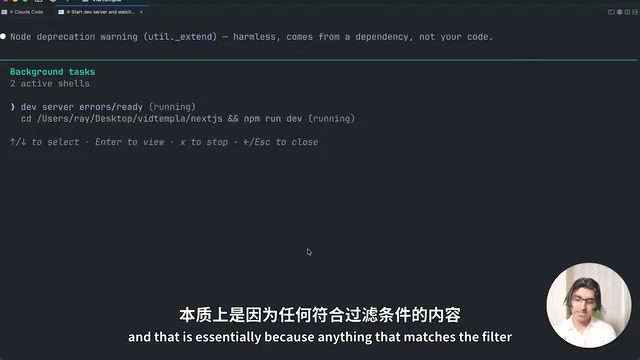
Suitable for real-time log scenarios. For example, running npm run dev to start a development server — Monitor listens to the output stream in real-time and immediately notifies the main session when errors or warnings appear.
The underlying logic of this mode is similar to tail -f app.log | grep -E "error|warn" — continuously tracking log files and filtering keywords, but Monitor bridges the matching results directly into Claude Code's response mechanism.
Typical scenario: You're developing a new feature and have Claude Code start the dev server while monitoring for errors. When you trigger an error while testing in the browser, Claude Code receives immediate notification and begins diagnosing — no need for you to manually report it.
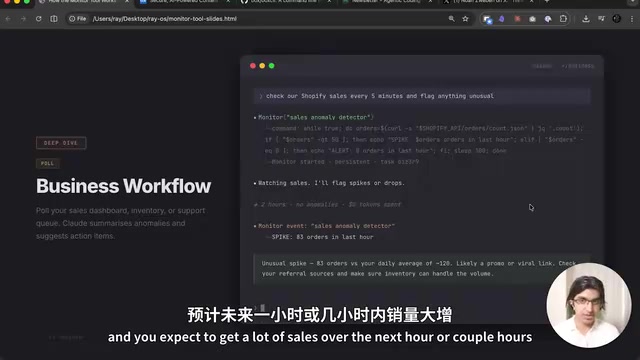
Poll and Diff Mode
Suitable for scenarios requiring periodic checks of an endpoint or state. Monitor checks at set intervals and only triggers event notifications when results meet specific thresholds.
This mode is closer to the "threshold alerting" concept in monitoring, similar to how Prometheus+Alertmanager works: continuously collecting metrics but only triggering alert actions when metrics cross preset thresholds. Compared to Stream Filter's purely passive listening, Poll and Diff actively initiates checks, making it more suitable for remote API monitoring, database status checks, and other scenarios where you can't directly subscribe to an output stream.
Practical Use Cases
Development Server Error Monitoring
The most straightforward use: start a dev server and have Monitor watch for all errors and warnings. You focus on writing code, and once an error is triggered on the browser side, Claude Code automatically receives and diagnoses it.
Test Suite Real-Time Feedback
When running a test suite, Monitor filters only for failed tests. Each time a test fails, Claude Code immediately begins diagnosing rather than waiting 10 minutes for all tests to complete. For large test suites, this efficiency improvement is enormous.
File Change Monitoring
Monitor a shared folder and immediately trigger processing workflows when new files arrive.
API Endpoint Status Monitoring
For example, monitoring a stock price API and only notifying Claude Code to take action when the price drops below a certain threshold.
Production Deployment Monitoring
Just deployed a critical change to production? Have Monitor watch the error logs for the next 2-3 hours, alerting and diagnosing immediately when the error rate exceeds 10 per second. Even if you've left your desk, Claude Code can respond quickly.
Why Does Monitor Save More Tokens?
The core logic is simple:
- Old approach (polling): Claude Code checks background process status every 30-60 seconds, consuming tokens with each check. Over long running periods, these small costs accumulate significantly.
- New approach (event-driven): Tokens are only consumed when filter conditions match. If no errors occur within 10 minutes, token consumption for those 10 minutes is zero.
This is the paradigm shift from "active inquiry" to "passive notification" — transforming token consumption from a function of time to a function of event count. This mirrors the evolution from polling to event-driven architecture in software engineering: early network servers used select() to poll all connections, while modern servers use mechanisms like epoll/kqueue to wake processing threads only when data arrives — this change increased single-machine concurrent connections from hundreds to hundreds of thousands. Monitor's significance to Claude Code is analogous to what epoll means for web servers.
Summary and Usage Recommendations
The Monitor tool is best suited for the following scenarios:
- Long-running development server monitoring
- Real-time feedback for large test suites
- Error rate monitoring after production deployments
- Any workflow that requires "waiting for specific events to occur"
If you use Claude Code for daily development, it's highly recommended to integrate Monitor into your workflow. Especially for projects requiring frequent test runs or deployments, the token savings will be very noticeable.
Key Takeaways
- The Monitor tool replaces traditional polling with an event-driven mechanism, consuming tokens only when events matching filter conditions occur
- Supports two monitoring modes: Stream Filter (real-time log stream filtering) and Poll and Diff (polling difference detection)
- Compared to Slash Loop's time-driven approach, Monitor runs at near-zero cost when no events occur
- Typical use cases include dev server error monitoring, real-time test feedback, production deployment monitoring, and API endpoint monitoring
- Monitor transforms Claude Code from passive waiting to active response — test failures can be diagnosed instantly rather than waiting for all tests to complete
- Its design philosophy is aligned with Unix pipeline philosophy and epoll event notification mechanisms — a mature engineering paradigm applied at the AI tool layer
Related articles
 Tutorials
Cursor + Codex Dual-IDE Collaboration: A Practical Methodology for Open-Source Project Customization
A complete methodology for open-source project customization based on real-world experience, detailing the Cursor+Codex dual-IDE workflow, seven-stage process, MVP validation, and AI source code reading techniques.
 Tutorials
Cursor Multi-Agent in Practice: Building a Full-Stack Next.js Blog in 50 Minutes
Build a full-stack blog in 50 minutes using Cursor IDE's multi-Agent mode with Next.js, Clerk auth, and Supabase. Learn the 4-phase AI Agent workflow and key integration pitfalls.
 Tutorials
Building an AI Software Factory from Scratch: A Cursor Engineer's Hands-On Experience with Multi-Agent Collaboration
Cursor engineer Eric shares practical insights on building an AI software factory: automation levels, guardrail design, parallel Agent management, and scaling to 1000+ Agents for 24/7 development.