Doubao AI Coding Debugger in Action: Efficiently Hunting Down Hidden Bugs in API Integration

Doubao AI efficiently pinpoints hidden integration bugs like casing mismatches and JSON structure errors.
This article demonstrates how Doubao AI coding assistant tackles the most frustrating hidden bugs in front-end/back-end integration. By simply pasting raw logs, input/output data, and code, developers get precise root cause identification for issues like parameter name casing inconsistencies and JSON nesting misalignment, along with architecture-aware fix recommendations with clear explanations.
The Integration Nightmare: A Hidden Bug That Keeps You Up All Night
Any developer who's done front-end/back-end integration knows the pain — some bugs are far more elusive than you'd ever imagine. The video demonstrates a classic scenario: the front end sends parameters, the back end receives them, the API returns a 200 status code, everything looks fine — but the data just doesn't match up. These "hidden bugs" produce no clear error messages, making them feel like searching for a needle in a haystack.

In modern front-end/back-end separation architectures, the front end (typically built with frameworks like React or Vue) and the back end (built with Spring Boot, Express, etc.) exchange data through RESTful APIs or GraphQL endpoints. Integration testing is essentially about verifying that two independently developed systems are fully aligned at the data contract level. An HTTP 200 status code only means the server successfully processed the request — it doesn't mean the business logic executed correctly. This is the root cause of many hidden bugs. The API doesn't throw an error, Postman tests pass, but the front-end page simply won't display the data. This kind of "silent failure" is far more maddening than an outright exception.
These context-mismatch logic traps are precisely the type of problem that's hardest for human developers to debug. Inconsistent parameter name casing, misaligned JSON nesting structures, field mapping discrepancies — any one of these can leave you staring at your screen late at night, checking everything over and over with no clue what's wrong. Traditional debugging approaches rely on line-by-line comparison and gut instinct, which is extremely inefficient.
How Doubao AI Coding Debugger Actually Works
One Step: Dump All the Context to the AI
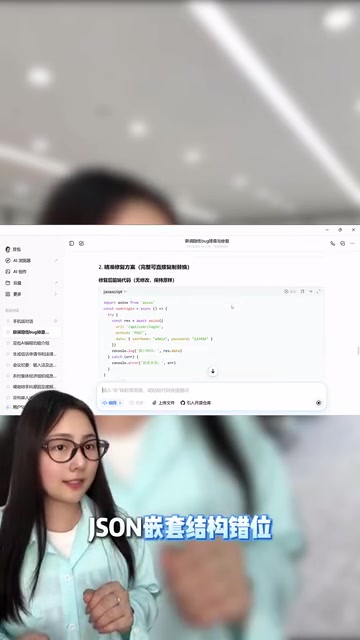
The approach demonstrated in the video is refreshingly straightforward — paste the complete error code, raw error logs, input parameters, and output data directly into Doubao, exactly as they are.

Here's a key point worth noting: you don't need to pre-organize or format the log information. Even messy raw logs can be parsed by Doubao for their structure and logical relationships. This is especially important for integration scenarios, where logs often come from multiple services and layers, producing a large and chaotic volume of information. Manually sorting through them is a time-consuming task in itself. In microservice architectures, a single API call might generate log output from the gateway layer, authentication service, business service, database layer, and more. Manually extracting key information from all of this requires the developer to have a clear understanding of the entire call chain — and this is precisely the part AI can handle for you.
Precise Root Cause Analysis: Not Just Finding the Problem, But Explaining Why
After analyzing the logs and code, Doubao automatically pinpoints the root cause. Typical cases mentioned in the video include:
- Inconsistent parameter name casing: The front end sends
userId, but the back end expectsUserId. HTTP 200 returns normally, but field mapping fails. - Misaligned JSON nesting structure: Mismatched data hierarchy levels cause parsed results to be empty.
The reason parameter name casing issues are so prevalent is that different programming languages and frameworks follow different naming conventions: JavaScript/TypeScript front ends universally use camelCase (e.g., userId), while C# back ends prefer PascalCase (e.g., UserId). Java back ends also use camelCase, but serialization frameworks (like Jackson or Gson) may alter field names depending on their default configuration. Additionally, case sensitivity handling during JSON serialization/deserialization varies by framework — some are case-insensitive by default, while others enforce strict matching. These differences are especially easy to overlook in cross-team collaboration.
More importantly, Doubao doesn't just mark the precise locations for changes — it also provides fix recommendations tailored to your business logic and project architecture. Each modification comes with a logical explanation of why the fix works. This means developers aren't blindly copying and pasting repair code; they can understand the essence of the problem and avoid similar issues in the future.
Why AI Is Particularly Well-Suited for Integration Debugging
Context Processing Is the Core Advantage
The essence of integration bugs is cross-system context inconsistency. When debugging manually, humans need to simultaneously hold front-end code logic, back-end API specifications, data format conventions, and other information threads in their heads — an extremely high cognitive load. AI models, on the other hand, are naturally adept at pattern matching and difference comparison across large volumes of text, which directly addresses the pain points of integration debugging.
From a technical perspective, this advantage of large language models (LLMs) stems from the attention mechanism in their Transformer architecture. This mechanism can establish associations between any positions in ultra-long text sequences — for example, simultaneously examining the fetch request parameters in front-end code and the parameter annotations in a back-end Controller, automatically detecting mismatches between the two. This cross-document semantic alignment capability is essentially pattern recognition learned from massive code repositories during training, covering hundreds of common integration error patterns. A human developer might need years of experience to build intuition for these error patterns, while AI can complete the comparison in milliseconds.

From "Emergency Tool" to "Efficiency Infrastructure"
The video creator mentions relying on it as a "lifeline whenever integration hits a wall," which reflects a broader trend: AI coding assistants are evolving from occasionally used auxiliary tools into indispensable infrastructure in developers' daily workflows. Beyond bug hunting, code optimization, logic review, and solution evaluation can all benefit from AI-powered efficiency gains.
This trend is accelerating across the entire industry. The AI coding assistant market is rapidly evolving from code completion to full-workflow assistance. Early tools primarily focused on auto-completion, while the new generation of products (including Doubao AI coding assistant and others) has expanded into more complex scenarios like debugging, code review, and architecture recommendations. Gartner predicts that by 2028, 75% of enterprise software engineers will use AI coding assistants, compared to less than 10% in early 2023. The core driver of this shift is the qualitative leap in LLMs' ability to understand code semantics — they are no longer just text-matching tools but intelligent collaborators capable of understanding program logic and business intent. For developers, the sooner you integrate AI tools into your workflow, the better positioned you'll be in this efficiency revolution.
Practical Tips: How to Maximize Doubao AI Debugging Effectiveness
Based on the hands-on experience shown in the video, here are some usage recommendations:
- Provide complete context: Don't just paste the error message — include input parameters, output data, and relevant code snippets. The more complete the information, the more precise the diagnosis. If multiple microservices are involved, try to include key code and logs from each node along the call chain, which helps the AI reconstruct the complete data flow path.
- Keep the original format: No need to preprocess logs — pasting them as-is actually preserves more useful information. Metadata in logs like timestamps, thread IDs, and request IDs may seem redundant but are actually crucial clues for the AI to determine call sequence and correlations.
- Pay attention to the reasoning behind fixes: Don't just look at the repair code — understand the logical analysis the AI provides. This is key to improving your own debugging skills. Every time you solve an integration problem with AI, it's a learning opportunity — internalize the AI's analytical approach into your own debugging methodology.
- Build a debugging habit: When you encounter integration issues, use AI for initial analysis first instead of stubbornly relying on gut instinct. This can significantly reduce wasted debugging time. Consider making "ask AI first" the first step in your debugging process — even if the AI doesn't directly provide the answer, its analysis direction can help you narrow down the scope.
For developers who frequently work on front-end/back-end integration, incorporating Doubao AI coding assistant into your debugging workflow is genuinely worth trying as an efficiency booster.
Related articles
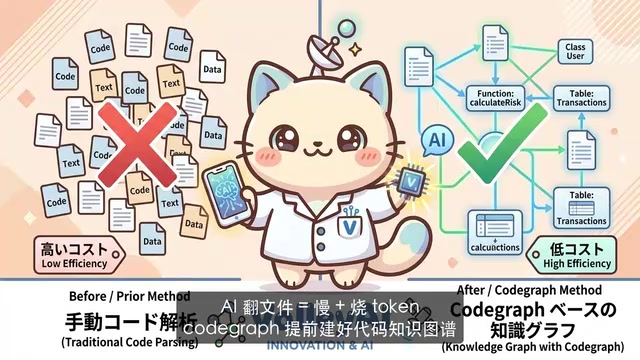
CodeGraph: The 50K-Star Open-Source Tool That Cuts AI Coding Token Usage in Half
CodeGraph is a 50K-star open-source tool that builds a code knowledge graph so AI coding assistants can locate code instantly—cutting Token usage by 47%, boosting speed by 22%, all running 100% locally.
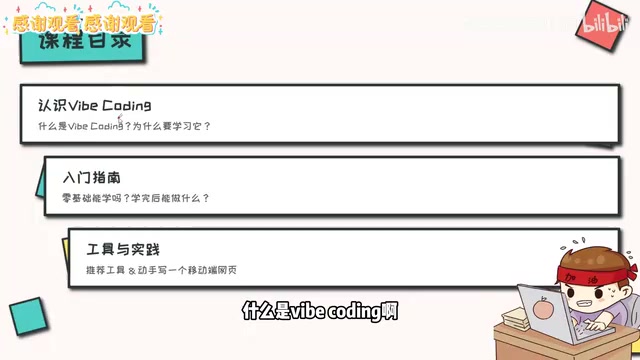
VibeCoding Beginner's Guide: A Complete Guide to Building Software with Natural Language from Scratch
VibeCoding lets anyone build software through natural language conversations with AI. Learn the core concepts, learning path, and practical methods to get started.

Using UU Accelerator to Speed Up Cursor: A Compliant Solution for Stable AI Coding in China
Learn how to use NetEase UU Accelerator to speed up Cursor AI coding tool in China, with step-by-step setup including node selection and launch configuration.