Observe Every Step of Claude Code Execution with Eflow Base: Full Tracing Configuration Guide

Use Eflow Base to achieve full observability of Claude Code's tool calls, tokens, and prompts.
This guide shows how to configure Eflow Base as a middleware layer between Claude Code and upstream LLMs, enabling full tracing of every tool call, system prompt assembly, and token consumption. It covers API key setup, application creation, interface publishing, and log analysis to turn AI Agent execution into observable, optimizable data.
Why Do We Need to Observe Every Step of an AI Agent?
When using AI coding assistants like Claude Code, we typically only see the final output — with no visibility into what happened in between. Which tools did the model call? How many tokens did each step consume? How was the system prompt assembled? This "black box" state makes optimization nearly impossible.
In traditional software engineering, observability is a mature concept built on three pillars: Logging, Metrics, and Tracing. But observability for AI Agents faces unique challenges: model inference is inherently non-deterministic, tool call chains can change dynamically, and the relationship between token consumption and task complexity is hard to predict. Tools like LangSmith, Helicone, and Braintrust are tackling this problem, while Eflow Base — as a locally controllable middleware solution — is particularly suited for developers with data privacy requirements.
Eflow Base is a middleware tool designed specifically to solve this problem. It records every conversation with Claude Code in full, including not just the final answer, but every tool callback, system prompt assembly, and token consumption detail. This article provides a detailed guide on configuring and using Eflow Base to achieve full tracing of Claude Code.
Configuring Model Provider API Keys
The foundation for everything that follows is configuring your API Key in Eflow Base's model provider settings. Currently, Eflow Base supports multiple interface protocols:
- DeepSeek: Install the corresponding plugin; for standard text tasks, select the Chat interface with base URL
api.deepseek.com - Alibaba Bailian: Connect via compatible interface
- Anthropic-compatible interface: You can configure the address as DeepSeek's compatibility endpoint
- OpenAI interface: During model detection, you can directly pull the official model list to confirm connectivity
- Gemini interface
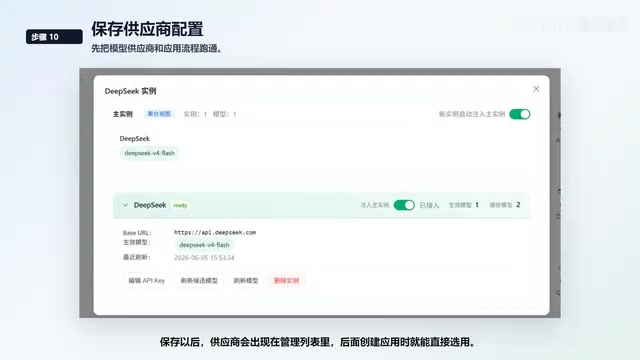
After saving, the provider appears in the management list and can be selected directly when creating applications.
Creating an Application as Middleware
Create a new application to serve as the middleware layer between Claude Code and the upstream LLM. The middleware/proxy architecture used by Eflow Base is a classic software design pattern — it sits between the client (Claude Code) and the upstream model API, transparently intercepting, recording, and forwarding requests. The advantage of this architecture is that no client or server code modifications are needed; you simply point the API request address to the middleware. Similar designs are widely used in API gateways (like Kong and Envoy), and Eflow Base adapts this concept specifically for LLM call scenarios.
Eflow Base automatically generates three base nodes:
- Start node: Contains built-in variables; context can be reorganized for Agent scenarios
- LLM node: The core inference node
- Reply node: Outputs the final result
Key Configuration Points
Pay special attention to handling context and History variables. Eflow Base has encapsulated them as frontend variables to simplify the configuration process.
For reasoning intensity, two strategies are available:
- Follow external request: Pass through whatever settings Claude Code sends to the LLM
- Fixed reasoning intensity: Always run the application with your predefined strategy
After configuration, check the flow for errors and confirm that model nodes and variables connect properly. Then enter preview mode and verify the entire chain with a simple request.
Publishing the Interface and Configuring Claude Code
Once the preview looks good, click publish to expose the application as an externally accessible interface. After publishing, go to the API page where Eflow Base provides endpoints compatible with both OpenAI and Anthropic interfaces.
Creating an API Key
Create a new API key for local Claude Code configuration. Note: The key is displayed only once — save it immediately after generation, as the full key will not be shown again.
Fill in the request address based on your deployment method:
- Local Docker deployment: Default
127.0.0.1:3100 - Source code deployment: Typically uses port
7800
If you haven't installed Claude Code yet, use NPM to install the latest version, then return to configuration to continue verification.
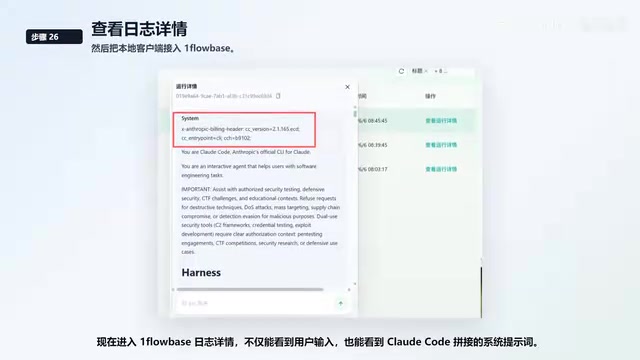
Observing Logs and Full Tracing
This is where Eflow Base delivers its core value. In the log details, you can see:
- User input: The original request content
- System prompt: The complete system prompt assembled by Claude Code
- Tool call records: Detailed information for every tool call
- Step-by-step results: Including intermediate reasoning processes
Understanding Claude Code's Tool Call Mechanism
Claude Code is built on Anthropic's Tool Use (function calling) capability, allowing it to autonomously decide to invoke tools like file read/write, command execution, and code search during conversations. Each tool call follows a loop: the model generates a tool_use request → the client executes the tool → returns the tool_result to the model → the model decides its next action. A complex programming task might involve dozens of such cycles, each consuming tokens and adding latency — which is exactly why observability of intermediate processes is so important.
Dynamic System Prompt Assembly
Claude Code's System Prompt is not static text but is dynamically assembled based on the current project context, user configuration, available tool list, and other information. This assembly process typically includes: base persona instructions, project-specific CLAUDE.md file content, schema descriptions of currently available tools, and various behavioral constraint rules. The complete system prompt can be thousands of tokens long, and understanding its composition is critical for debugging abnormal Agent behavior. Through Eflow Base's logs, you can view the full system prompt actually sent to the model in each request.
Complete Records for Complex Tasks
When Claude Code executes complex tasks, the logs continue to show model requests, tool calls, and results for each step. Three action buttons are available on the right side:
- Copy output
- View specific log details
- View callback history
Opening the details and callback history displays two panels side by side, making it easy to compare what happened at each step.
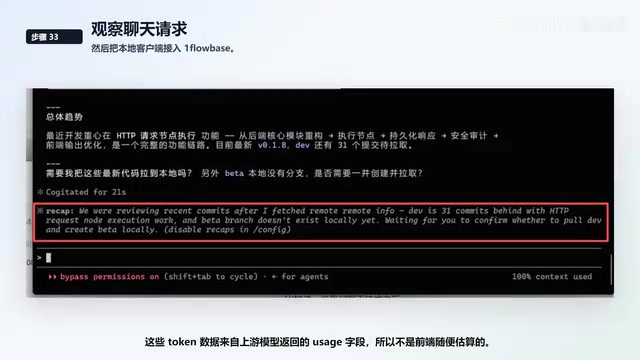
Precise Token Consumption Statistics
The callback results and token consumption for every tool execution are recorded as step data. This token data comes from the usage field returned by the upstream model — it's not a rough frontend estimate — ensuring data accuracy.
Tokens are the basic billing unit for large language models, including input tokens (prompt tokens) and output tokens (completion tokens). In Agent scenarios, context continually expands due to multi-turn tool calls — each call must carry the previous conversation history and system prompt, causing input tokens to grow cumulatively. A seemingly simple code refactoring task might consume tens of thousands or even hundreds of thousands of tokens due to repeated file reads and command executions. Precise token statistics help developers identify which steps are cost-heavy, enabling optimization of prompt design or adjustment of tool call strategies.
Interestingly, even summary requests automatically initiated by the client are recorded. When Claude Code performs an automatic session summary, you can see the complete information for that request in the logs as well.
Data Reports and Trend Analysis
Beyond step-level logs, Eflow Base provides comprehensive reporting capabilities:
- Log reports: Column fields support dynamic configuration
- Application activity monitoring: Real-time display of application status, including current execution, protocol in use, and monitoring status
- Historical data reports: Analyze call trends, consumption changes, and anomalies
- Historical statistics charts: Observe call distribution and quickly identify which request types are most frequent
Through these reports, you can put costs, call counts, and anomalies into a single review pipeline, forming a complete optimization loop.
Summary
The core value of Eflow Base isn't making a model call for you — it's turning every step of Claude Code's execution into observable, reviewable, and optimizable data.
For developers looking to optimize AI Agent workflows, "observation" is the first step toward optimization. Only by clearly knowing what happened at each step, how many resources were consumed, and where anomalies occurred can you make targeted improvements. The full tracing capability provided by Eflow Base is the critical bridge connecting "using AI" and "optimizing AI."
Related articles
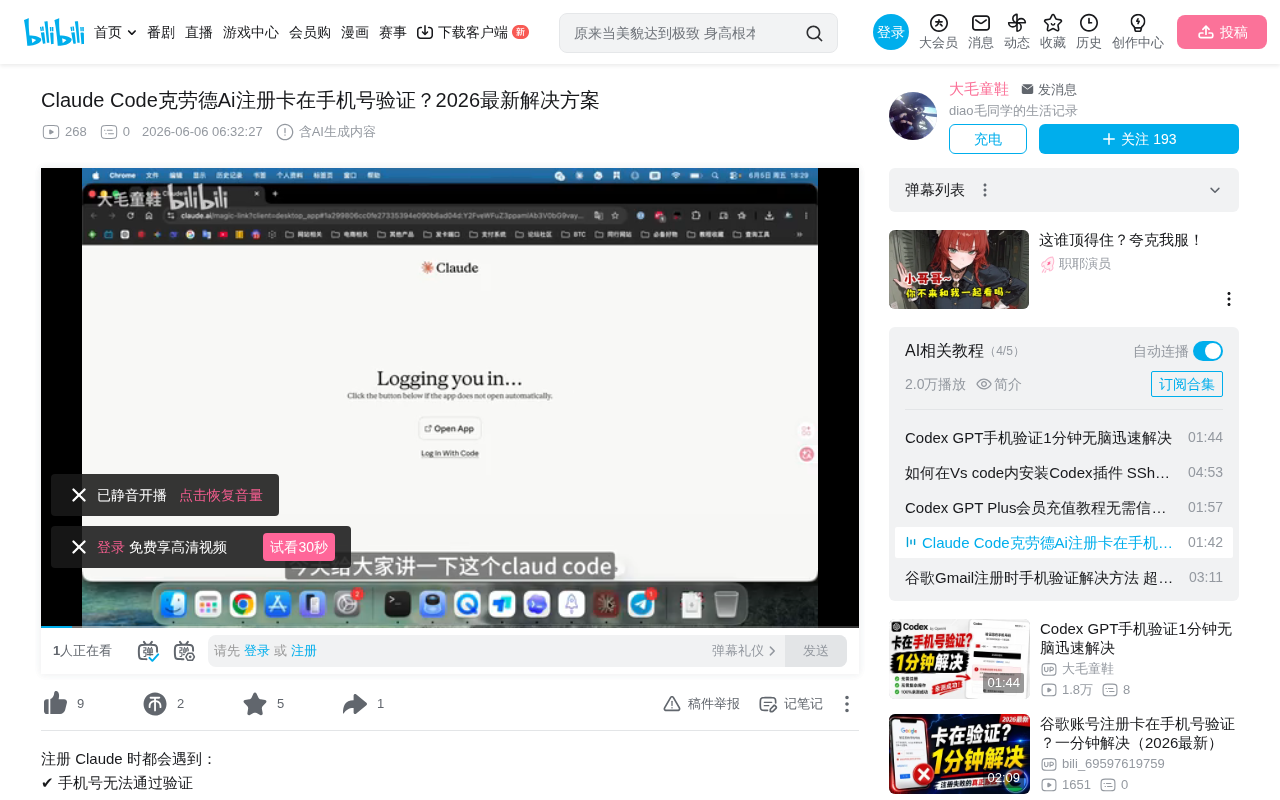
Claude Phone Number Verification Failed? SMS Receiving Platform Solutions
Guide to solving Claude registration phone verification failures using online SMS receiving platforms. Get a temporary foreign number and complete verification in 5 steps.
Apple Executives' Secret Meeting Exposed: Admitting AI Lag, WWDC Counterattack Plan Emerges
Bloomberg reveals Apple executives held a secret meeting without Tim Cook, admitting they've fallen behind in AI. With WWDC 2025 approaching, Apple's counterattack plan against OpenAI and Google emerges.

iOS 27 New Details Leaked: Major Notification Center Gesture Changes, Find My Interface Redesign
iOS 27 leaks reveal major changes: Notification Center gesture moves to upper left with new animations, Find My visual redesign, Photos Clean Up improvements, and under-the-hood security upgrades.