Python Quantitative Backtesting in Practice: A Complete Guide to Building Stock Trading Strategies with Zipline

A hands-on guide to building and backtesting stock trading strategies with Python's Zipline Reloaded framework.
This guide walks through quantitative backtesting with Python's Zipline Reloaded framework. It covers building random, SMA crossover, and MACD trading strategies, configuring YFinance as a free data source, adding real-world constraints like leverage limits and trading costs, and managing multi-asset portfolios for diversified trend-following approaches.
Introduction
Quantitative Trading has long been a popular direction for programmers crossing into the finance domain. This article provides an in-depth guide on how to use Python's Zipline framework for stock trading strategy backtesting. Zipline employs an Event-Driven backtesting approach, simulating historical trades day by day to help us validate how custom strategies perform over specific time periods.
This article covers the following topics:
- Complete implementation of random, SMA crossover, and MACD strategies
- Data source configuration (Quandl and YFinance)
- Leverage control and short-selling mechanisms
- Trading cost simulation
- Multi-asset portfolio management
Disclaimer: This article is a programming tutorial and does not constitute any investment advice.
Introduction to Zipline Reloaded and Installation
Project Background
Zipline was originally developed by Quantopian, but the company has since ceased maintenance. It is now maintained by Stefan Janssen under the name "Zipline Reloaded," keeping this excellent backtesting framework alive. For developers looking to perform quantitative backtesting with Python, Zipline Reloaded is one of the most mature open-source options available.
Installation
The installation process is straightforward and supports all major operating systems:
# Standard installation
pip install zipline-reloaded

# Using UV package manager
uv add zipline-reloaded
You'll also need to install the following dependencies:
pandas: Data processingmatplotlib: Result visualizationta-lib: Technical analysis indicator calculationsyfinance: Free data download from Yahoo Finance
Building Your First Strategy: Random Trading
Zipline Core Architecture
A Zipline strategy consists of two core functions:
initialize(context): The initialization function that sets up trading assets and initial parameters. It runs only once at the start of the backtest.handle_data(context, data): The daily trading logic — the heart of the strategy.
from zipline.api import order_target, record, symbol
from zipline import run_algorithm
import pandas as pd
import random
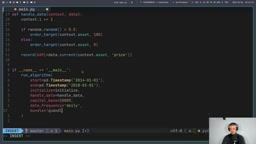
def initialize(context):
context.i = 0
context.asset = symbol('AAPL')
def handle_data(context, data):
context.i += 1
if random.random() > 0.5:
order_target(context.asset, 100)
else:
order_target(context.asset, 0)
record(AAPL=data.current(context.asset, 'price'))
order_target means "target position" — if the target is 100 shares and you currently hold 50, it buys 50 more; if you already hold 100, it does nothing. This design makes position management intuitive.
Running the Backtest
You can run a backtest via the command line or programmatically:
if __name__ == '__main__':
    results = run_algorithm(
        start=pd.Timestamp('2014-01-01'),
        end=pd.Timestamp('2018-01-01'),
        initialize=initialize,
        handle_data=handle_data,
        capital_base=10000,
        data_frequency='daily',
        bundle='quandl'
    )
    results.to_pickle('results.pickle')
The random strategy results show growth from $10,000 to approximately $19,000 — but this includes leverage effects and isn't entirely reliable. This illustrates exactly why we need to add real-world constraints to our backtests.
SMA Dual Moving Average Crossover Strategy
Strategy Logic
The SMA dual moving average crossover is one of the most classic quantitative trading strategies: a buy signal is generated when the short-term moving average (30-day) crosses above the long-term moving average (100-day), and a sell signal when it crosses below.
def handle_data(context, data):
    context.i += 1
    if context.i < 100:
        return  # Wait for enough data to accumulate

    sma_30 = data.history(context.asset, 'price', bar_count=30, frequency='1d').mean()
    sma_100 = data.history(context.asset, 'price', bar_count=100, frequency='1d').mean()

    if sma_30 > sma_100:
        order_target(context.asset, 100)
    elif sma_30 < sma_100:
        order_target(context.asset, 0)

    record(sma_30=sma_30, sma_100=sma_100)
Adding Real-World Constraints
By default, Zipline allows unlimited leverage, which doesn't reflect real trading conditions. Add the following constraints:
from zipline.api import set_long_only, set_max_leverage

def initialize(context):
    set_long_only()        # Disable short selling
    set_max_leverage(1.0)  # Max leverage of 1 (no margin trading)
You should also check whether there's enough cash before placing orders to avoid triggering leverage limits:
if context.portfolio.cash >= 100 * data.current(asset, 'price') + 10:
    order_target(context.asset, 100)
MACD Strategy with TA-Lib Integration
Computing MACD Indicators with TA-Lib
MACD (Moving Average Convergence Divergence) is a more sophisticated technical indicator than SMA. It uses the difference between fast and slow exponential moving averages to determine trends. TA-Lib makes the calculation straightforward:
import talib
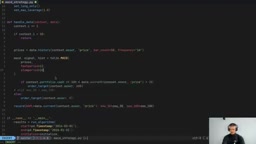
def handle_data(context, data):
context.i += 1
if context.i < 50:
return
prices = data.history(context.asset, 'price', bar_count=50, frequency='1d')
macd, signal, hist = talib.MACD(prices, fastperiod=12, slowperiod=26, signalperiod=9)
macd = macd[-1]
signal = signal[-1]
if macd > signal:
order_target(context.asset, 100)
elif macd < signal:
order_target(context.asset, 0)
The MACD strategy performed well during the test period, with portfolio value growing from $10,000 to approximately $14,000 (without leverage), yielding a return of about 62%. Compared to the random strategy, MACD provides more stable signals.
Using YFinance for Free Market Data
Why You Need an Alternative Data Source
Quandl requires an API key, and the free tier only provides access to limited historical data. YFinance offers free market data with broader coverage, making it more suitable for individual developers.
Data Download and Bundle Registration
First, write a script to save YFinance data in a Zipline-compatible CSV format:
import yfinance as yf
import pandas as pd

tickers = ['AAPL', 'META', 'NVDA', 'TSLA', 'GOOG']
for t in tickers:
    ticker = yf.Ticker(t)
    df = ticker.history(start='2014-01-01', end='2026-01-01')
    # Rename columns, format dates, export CSV
    df.to_csv(f'zipline_csvs/daily/{t}.csv', index=False)
Then register a custom bundle in ~/.zipline/extension.py:
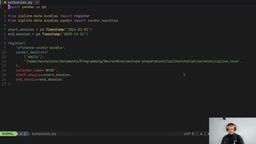
Once registered, run the following command to ingest the data:
zipline ingest -b yfinance_csv_dir_bundle
Multi-Asset Portfolios and Trading Cost Simulation
Multi-Asset Portfolio Trading
When extending a strategy to multiple assets, use order_target_percent to allocate capital proportionally:
def initialize(context):
    context.assets = [symbol('AAPL'), symbol('NVDA'), symbol('META'), symbol('TSLA'), symbol('GOOG')]
    context.target_weight = 0.19  # Allocate 19% of capital to each stock

def handle_data(context, data):
    for asset in context.assets:
        if not data.can_trade(asset):
            continue
        # Execute MACD strategy independently for each asset
        order_target_percent(asset, context.target_weight)
The multi-asset portfolio showed remarkable performance from 2014 to 2025. A portfolio containing tech stocks like NVIDIA and Apple grew from $10,000 to over $80,000, demonstrating the power of diversification combined with trend following.
Simulating Real Trading Costs
Real-world trading involves commissions and slippage. Zipline provides a comprehensive cost simulation mechanism:
from zipline.finance import commission, slippage
from zipline.api import set_commission, set_slippage

def initialize(context):
    set_commission(commission.PerShare(cost=0.001, min_trade_cost=0))
    set_slippage(slippage.FixedSlippage(spread=0.01))
Adding trading costs makes backtest results more closely resemble real trading conditions, helping us evaluate the practical viability of a strategy.
Summary and Practical Recommendations
Zipline Reloaded is a fully-featured Python quantitative backtesting framework suitable for strategy validation from beginner to advanced levels. Here are the key takeaways:
- Always set leverage limits and cash checks to avoid unrealistic backtest results
- Use YFinance for free data to overcome Quandl's access limitations
- Include trading cost simulation to make backtests closer to real trading scenarios
- Diversify risk with multi-asset portfolios, but set asset weights thoughtfully
Backtest results only represent historical performance and cannot guarantee future returns. Strategy development is just the first step in quantitative trading — risk management and live validation are equally important. It's recommended to thoroughly validate strategies through paper trading before considering live deployment.
Related articles
Building a WeChat Mini Program with AI from Scratch: How a Non-Coder Created a Poetry Memorization App in 7 Days
Non-coder Tao Qigu used AI to build and launch a WeChat Mini Program in 7 days. A full breakdown of AI-assisted development, debugging, and product design for elderly users.
SpaceX: A Multi-Dimensional Analysis of Engineering Marvels, Business Revolution, and the Mars Vision
A deep multi-dimensional analysis of SpaceX covering engineering breakthroughs, business revolution, organizational culture, and the Mars colonization vision that is redefining the boundaries of human space exploration.
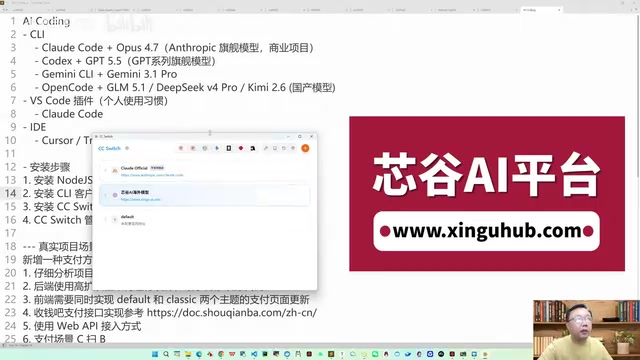
Claude Code Practical Guide: From Installation & Configuration to Production-Grade Project Delivery
Complete guide to Claude Code + Opus for production projects: CC Switch setup, engineering-minded prompting, and a real case study delivering a complex payment system in 4 hours.