The Complete Guide to OpenTelemetry: The Three Pillars of Observability & DevOps in Practice
The Complete Guide to OpenTelemetry: T…
OpenTelemetry provides a unified observability standard for distributed systems, enabling intelligent operations with AI.
OpenTelemetry is a CNCF open-source project that solves the fragmentation of logs, metrics, and trace data across different tools through a unified standard. Its core architecture consists of three stages: instrumentation, collector, and backend, supporting multiple languages and platforms. Combined with AI, observability evolves from reactive monitoring to proactive prevention, enabling anomaly detection, predictive alerts, and natural language queries that dramatically improve DevOps efficiency.
Introduction: Observability Thinking — From Coffee Shops to Airports
Imagine you run a coffee shop, and one morning customers start complaining that orders are taking too long. Where's the problem? Is it the barista? The coffee machine? Or a supplier delay? To answer this, you need to be able to "see" every aspect of your shop's operations — this is the core concept of Observability.
The concept of observability originates from control theory, first proposed by Hungarian-American engineer Rudolf E. Kálmán in 1960 to describe whether a system's internal state can be inferred from its external outputs. In software engineering, observability differs fundamentally from traditional monitoring: monitoring means predefining the questions you want answered and setting up alerts; observability means giving a system enough information output capability to answer questions you never anticipated. In other words, monitoring tells you "whether the system is healthy," while observability helps you answer "why the system is unhealthy."
In this video by YouTube creator Itayesh, he takes the real daily life of a DevOps engineer as his starting point and systematically explains the essence of OpenTelemetry, the problems it solves, and how AI is changing the future of operations monitoring. This article distills the core knowledge points to help you build a complete understanding of OpenTelemetry.
The Three Pillars of Observability: Logs, Metrics, and Traces
The complexity of modern software systems far exceeds that of a coffee shop — it's more like a massive airport with hundreds of flights, countless staff members, and multiple subsystems all running simultaneously. To monitor such a system, you need three pillars:
Logs: Detailed Records of Events
Logs are like a diary — every time an event occurs in your application, an entry is recorded. For example: "User logged in at 15:00," "Payment completed at 15:10." They provide detailed context about what happened and are the most fundamental source of information when troubleshooting.
Metrics: A Numerical Dashboard of System Health
Metrics are like the numbers on a car dashboard — CPU usage, memory consumption, request counts, etc. Some numbers you can understand at a glance; others require experience to interpret. The advantage of metrics is that they quickly reflect the overall state of the system.
Traces: The Complete Journey of a Request
This is the most critical part. Traces are like GPS tracks — they show the complete journey of a request from the moment it enters the system to completion, spanning all microservice nodes. For distributed systems, tracing is the core method for identifying performance bottlenecks.
In the technical implementation of distributed tracing, a complete request journey is called a Trace, and a Trace is composed of multiple Spans. Each Span represents an independent unit of work (such as an HTTP call or a database query) and contains information like the operation name, start/end time, status code, and attribute tags. Spans form a tree structure through parent-child relationships. The key technology for cross-service tracing is Context Propagation: when Service A calls Service B, it injects the Trace ID and Span ID into the HTTP headers (following the W3C Trace Context standard). When Service B receives the request, it extracts this information and creates a child Span, linking the entire call chain together. This is why in microservice architectures, even when a request passes through a dozen services, we can still see the complete call chain.
What Problem Does OpenTelemetry Solve?
The Fragmented Monitoring Dilemma
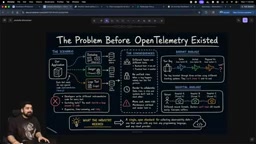
Returning to the airport analogy: imagine every airline uses a completely different baggage tracking system. When a piece of luggage gets lost after transiting through three airlines, who can track it? The answer is — no one. Because these systems can't communicate with each other.
This is exactly the real dilemma software teams faced before OpenTelemetry:
- The company uses Datadog to collect metrics
- Uses Jaeger for tracing
- Uses another tool for log management
- Each tool requires its own instrumentation library
- Frontend and backend teams use different collection and analysis mechanisms
It's like every hospital in a city using a different format for medical records — when a patient transfers, the new doctor simply can't read the old records. The entire industry needed a unified open standard.
The Birth of OpenTelemetry
OpenTelemetry (OTel for short) was born for exactly this purpose. It's an open-source project under CNCF (the same organization that manages Kubernetes), providing developers with a single, standardized way to collect logs, metrics, and traces — regardless of programming language, cloud provider, or monitoring tool.
CNCF (Cloud Native Computing Foundation) was established in 2015 under the Linux Foundation and is the most important open-source organization in the cloud-native technology space. Beyond managing Kubernetes, the de facto standard for container orchestration, CNCF also hosts hundreds of projects including Prometheus (monitoring), Envoy (service mesh proxy), Helm (package management), and etcd (distributed key-value store). OpenTelemetry has reached the "Incubating" level in CNCF's project maturity model and has core contributors from Google, Microsoft, Splunk, Lightstep, and other companies. CNCF's endorsement means OpenTelemetry has long-term community support and enterprise-grade reliability.
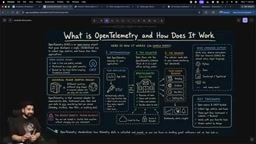
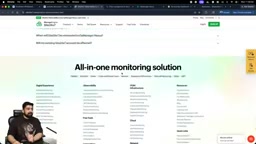
The video uses an elegant analogy: OpenTelemetry is like a universal power adapter you carry when traveling. Different countries have different outlet shapes, but a universal adapter lets you charge anywhere. Similarly, you only need to instrument your application once with the OpenTelemetry standard, and you can send data to any monitoring tool — whether it's Datadog, Grafana, New Relic, or any other platform.
OpenTelemetry Core Architecture Explained
OpenTelemetry's workflow consists of three key steps:
Step 1: Instrumentation
Add OpenTelemetry libraries to your application code. These libraries automatically begin collecting data: execution time of each function, errors that occur, number of incoming requests, and other critical information. Instrumentation is the starting point of the entire observability system.
Technically, instrumentation comes in two main approaches: manual instrumentation and automatic instrumentation. Manual instrumentation requires developers to explicitly call the OpenTelemetry API in their code to create Spans (trace units), record attributes, and events — suitable for business logic requiring fine-grained control. Automatic instrumentation leverages language runtime features (such as Java's bytecode injection, Python's monkey patching, .NET's IL rewriting) to automatically capture telemetry data from common operations like HTTP requests, database queries, and message queue operations without modifying business code. For example, in Java, OpenTelemetry provides a Java Agent (-javaagent parameter) that only needs to be added to the startup command to automatically generate trace data for Spring Boot, gRPC, JDBC, and other frameworks.
Step 2: Collector
Data flows into the OpenTelemetry Collector — think of it as a post office that sorts mail by zip code. The Collector is a standalone service running on a separate server (not the main server), so even if the application crashes, data collection continues uninterrupted. It can receive, filter, transform data, and export it to multiple backends.
From an architectural design perspective, the OpenTelemetry Collector uses a Pipeline architecture composed of three core components: Receiver, Processor, and Exporter. The Receiver handles incoming telemetry data from applications and supports multiple formats including OTLP, Jaeger, Zipkin, and Prometheus. The Processor handles intermediate processing logic such as batching, sampling, filtering, and attribute modification. The Exporter sends processed data to one or more backends. The Collector has two deployment modes: Agent mode (deployed as a Sidecar or DaemonSet on each node) and Gateway mode (deployed as a centralized service). This decoupled design makes data collection completely independent from data consumption, greatly improving system flexibility and maintainability.
Step 3: Backend
The Collector sends data to your chosen monitoring tool (such as Grafana, Jaeger, etc.), where you can visualize dashboards, set up alerts, and analyze anomalies.
Five Key Components of OpenTelemetry
| Component | Purpose |
|---|---|
| API | Defines rules and commands, telling OTel what to measure |
| SDK | The actual implementation of the API, injected into code |
| Auto Instrumentation | Automatically collects data without manual business code changes |
| Collector | Standalone service for receiving, filtering, and forwarding data |
| OTLP | OpenTelemetry Protocol, the standard protocol for inter-component communication |
OTLP (OpenTelemetry Protocol) is the telemetry data transmission protocol defined by OpenTelemetry, supporting both gRPC and HTTP/protobuf transport methods. Compared to earlier Zipkin formats or Jaeger's Thrift protocol, OTLP's design goal is to be efficient, reliable, and unified — it uses a single protocol format to transmit all three data types: logs, metrics, and traces. OTLP supports a request/response model where the receiver returns acknowledgments to ensure no data is lost. Currently, virtually all major observability backends (Datadog, Grafana Tempo, Elastic APM, AWS X-Ray, etc.) natively support OTLP protocol ingestion, allowing users to freely switch backend platforms without modifying application instrumentation code.
Practical Case Study: Debugging a Food Delivery App Crash
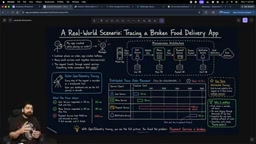
Imagine you work at a food delivery company. The app crashes when a customer places an order, and your manager calls demanding a quick fix.
Modern applications consist of multiple microservices: login service, restaurant menu service, payment service, notification service, etc. These microservices may be written in different languages (Python, Java, JavaScript) and connect to different databases.
With OpenTelemetry's tracing enabled, every step of the customer's request is recorded:
- User service response: 50ms ✓
- Menu service response: 80ms ✓
- Payment service response: 400ms ⚠️ (the bottleneck)
This end-to-end visibility is the power of Distributed Tracing — you can immediately pinpoint that the problem is in the payment service, rather than blindly searching through dozens of microservices.
How AI Is Revolutionizing DevOps Monitoring
When the massive amounts of data collected by OpenTelemetry are combined with AI, a qualitative leap occurs:
The field combining AI with operations is called AIOps (Artificial Intelligence for IT Operations), a concept first introduced by Gartner in 2017. AIOps platforms typically integrate big data analytics and machine learning to perform real-time analysis on massive operational data. Current core AIOps capabilities include: anomaly detection based on time series analysis (using LSTM, Transformer, and other models to identify metric deviations), root cause analysis based on causal reasoning (locating fault sources through service dependency graphs and temporal correlations), capacity prediction based on historical patterns, and intelligent Q&A based on large language models.
Anomaly Detection
AI can find that one anomalous request among a hundred thousand normal ones. In the traditional approach, DevOps engineers need to manually scan through charts looking for root causes; now they just click a button and AI provides a probable root cause analysis.
Predictive Alerts
The video demonstrates a typical scenario: disk utilization is currently at 85%, and AI predicts it will reach 100% within 28 days. The system not only raises an alert but also provides:
- Potential impact: May affect services hosted on this server
- Recommended actions: Delete large files or expand capacity
- Automated workflows: Can directly create a remediation ticket or assign it to another engineer
Natural Language Queries
You no longer need to master SQL or specific query languages — you can directly ask in natural language: "Why did IO operations spike at this time?" AI will provide explanations and recommendations, dramatically lowering the barrier to operations work. Platforms like Datadog, Dynatrace, and Splunk have deeply integrated AI capabilities, while open-source solutions like Grafana support AI-assisted analysis through their plugin ecosystem. With the advancement of LLMs, natural language-driven observability queries are becoming an industry standard.
The Real Daily Work of a DevOps Engineer
The video shows the real dashboards DevOps engineers face every day: business overviews, server status, storage configurations, backup status, network traffic, database health... all requiring professionally trained eyes to interpret.
When a metric breaches a threshold, engineers need to:
- Click the alert to view details
- Analyze context (disk bandwidth, IO operations, outbound network traffic, etc.)
- Determine whether immediate intervention is needed
- Execute repairs or upgrades
As the video creator puts it: "From the outside, we just built an application. But when it reaches the DevOps engineer's hands, this is their real work, day in and day out."
Conclusion: From Reactive Firefighting to Proactive Prevention
OpenTelemetry isn't just another monitoring tool — it's a unified standard that enables seamless collaboration between different teams, languages, and tools to collectively safeguard system health. Combined with AI, modern observability is evolving from "reactive firefighting" to "proactive prevention," which is profoundly significant for every software engineer.
Whether you're a beginner developer or a seasoned DevOps engineer, understanding OpenTelemetry's core concepts and architecture will help you more efficiently identify and resolve problems in the era of distributed systems.
Key Takeaways
- OpenTelemetry is a CNCF open-source project that provides a unified collection standard for logs, metrics, and traces, solving the data silo problem between multiple tools
- The three pillars of observability are Logs, Metrics, and Traces, with distributed tracing capable of precisely identifying performance bottlenecks in microservice architectures
- OpenTelemetry's core architecture consists of three steps: Instrumentation, Collector, and Backend, supporting all major programming languages
- When combined with AI, OpenTelemetry enables automatic anomaly detection, root cause analysis, predictive alerts, and natural language queries, dramatically reducing manual investigation work for DevOps engineers
- Modern DevOps engineers face complex monitoring dashboards daily, needing to simultaneously monitor the health status of servers, storage, networks, databases, and other multi-dimensional metrics
Related articles
 Deep Dives
Deep Dive into How OpenClaw (Open-Source Crayfish) AI Agent Works
Deep analysis of OpenClaw AI Agent internals: System Prompt, tool calling, SubAgents, Skill system, memory, and Context Engineering explained.
 Deep Dives
Demystifying Transformer: A Word-Continuation Function, Deconstructed
Understand Transformer through the lens of word continuation. Breaking down language generation into Embedding, Transformer Block, and Probability output modules for intuitive understanding.
 Deep Dives
Five Core Differences Between Claude Code and Regular AI Chat
A detailed comparison of Claude Code vs regular AI chat across five dimensions: interaction, context understanding, execution, memory, and tool integration.