Dataviz Rankings: A Daily Cross-Platform Tool Spanning GitHub, NPM, PyPI, and CRAN

Dataviz ranks data visualization libraries daily by aggregating GitHub, NPM, PyPI, and CRAN data.
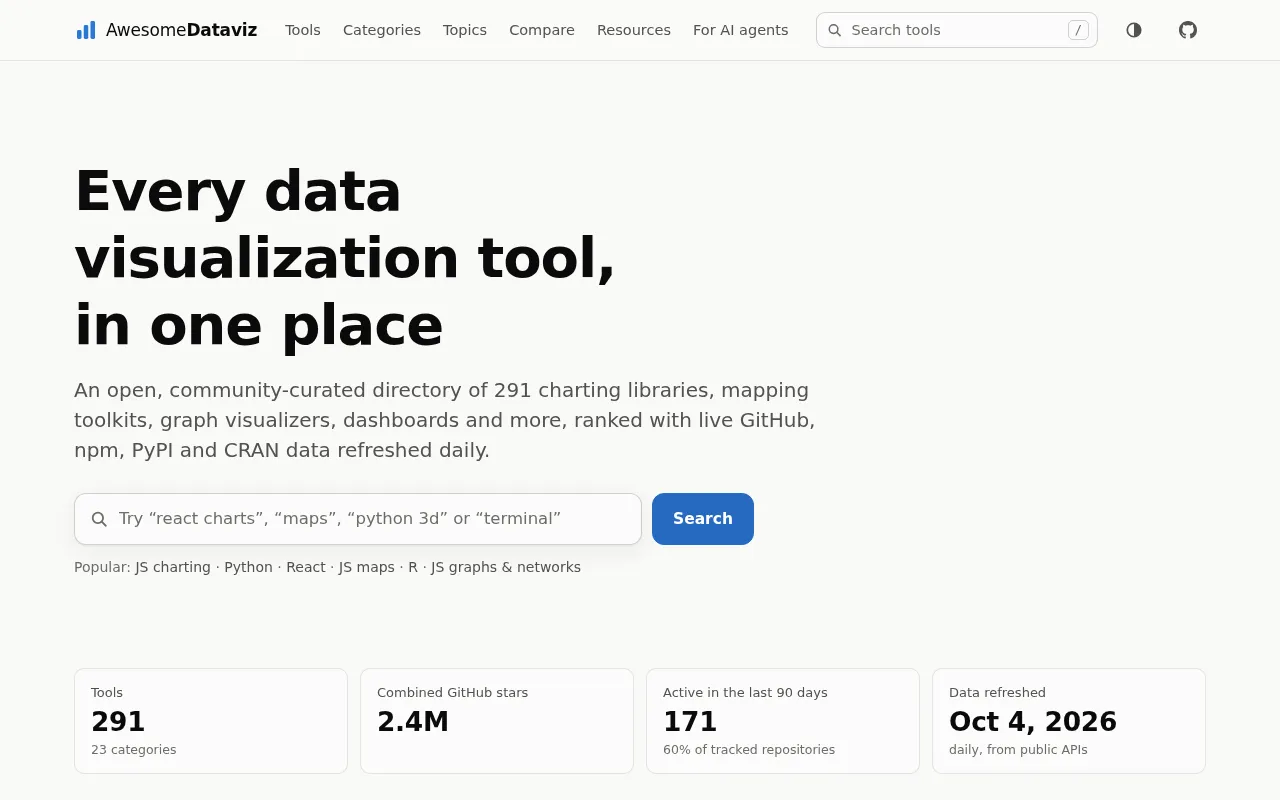
Dataviz is an open-source project shared on Hacker News Show HN that automatically aggregates daily data from GitHub, NPM, PyPI, and CRAN to rank data visualization libraries across ecosystems. It addresses a real pain point: viz tools are scattered across JavaScript, Python, and R stacks with no unified comparison view. By combining Stars, download counts, and other signals with daily updates, it surfaces dynamic trends to help developers spot rising or fading tools — while acknowledging that popularity metrics have inherent limitations and should serve as a research starting point, not a final verdict.
A Multi-Source Aggregator for Data Visualization Library Rankings
A project called Dataviz has been catching attention in the Hacker News Show HN section. Its premise is straightforward: every day, it pulls data from four major code and package management platforms — GitHub, NPM, PyPI, and CRAN — and ranks libraries and tools in the data visualization space.
For developers who work regularly in frontend development, data science, or statistical analysis, choosing the right visualization library is often a frustrating decision. NPM alone offers D3.js, ECharts, Chart.js, and many more. The Python ecosystem has Matplotlib, Plotly, and Seaborn. And the R community has built its own world around ggplot2. These libraries are scattered across different ecosystems with no unified way to compare them side by side. Dataviz aims to fill that gap.
Why Aggregate Data Across Four Platforms
Data visualization isn't the domain of any single programming language. It spans three major tech stacks — Web frontend (JavaScript/NPM), Python data science (PyPI), and R statistical analysis (CRAN) — while GitHub serves as the common ground for measuring code activity and community engagement across all of them.
Looking at any one platform in isolation gives you an incomplete picture. GitHub Stars reflect community interest but don't necessarily translate to real-world usage. NPM and PyPI download counts capture actual adoption at scale, but are skewed by automated builds and CI pipelines. CRAN, as R's official repository, represents the preferences of the statistics community. Combining all four dimensions with daily updates produces a more three-dimensional view of the ecosystem — which libraries are rising, and which tools dominate within a particular community.
The Value of Daily Updates
Tech ecosystems move fast. An emerging visualization library can reshape the landscape within months. By updating rankings daily rather than publishing a static list, the project captures trend momentum. Developers can see whether a library is on the rise or whether a once-popular tool is slowly being abandoned by its community. That dynamic perspective is especially useful when making technology decisions.
CRAN (Comprehensive R Archive Network) is R's official package repository, maintained by the R core team. All submitted packages must pass rigorous quality review and testing. Unlike the open publishing models of NPM or PyPI, CRAN has a relatively high barrier to entry — which means its download data tends to more accurately reflect actual usage in academic and statistical analysis contexts, with less noise from placeholder packages or test releases. ggplot2, the most iconic visualization package on CRAN, is built on the "Grammar of Graphics" design philosophy, which has deeply influenced similar libraries across other language ecosystems — including Python's Plotnine and the API design of several declarative visualization libraries in JavaScript.
When evaluating a visualization library's activity level, GitHub Stars and NPM/PyPI download counts often tell different stories. Stars are cumulative and rarely decrease, making it easy to overestimate projects that were once popular but are no longer maintained. Download counts, on the other hand, can be inflated when a large project lists a library as a dependency — even if end users never interact with it directly. Automated installs from CI/CD pipelines are another common source of distortion: every build triggers a download count, regardless of whether a developer actually chose the library. This is exactly why combining multiple dimensions and watching trends rather than absolute numbers provides a more reliable basis for judgment.
Practical Use Cases for This Type of Ranking Tool
Different users will find different value in an aggregated leaderboard like this.
Technology evaluators can quickly see which libraries are most popular in a given niche — interactive charts, geospatial visualization, dashboards — reducing the research overhead. Open source maintainers can see where their project stands relative to competitors and assess the competitive landscape. Researchers and analysts can use cross-ecosystem data to observe broader trends in the development of data visualization tooling.
That said, it's worth keeping a clear-eyed view of the limitations. Any ranking based on download counts and Star numbers has inherent blind spots. Popularity doesn't equal fitness for purpose. A niche library that excels in a specific use case may never appear near the top of any leaderboard. Rankings should serve as a starting point for research, not a final decision-making authority.
Community Validation Through the Show HN Format
As a Show HN project, Dataviz is still in its early stages, with relatively modest traction so far (11 upvotes, 1 comment). Projects like this are typically built by independent developers scratching their own itch, then shared with the community for feedback.
From a product perspective, the real competitive strength of an aggregated ranking tool lies in data accuracy, update timeliness, and the soundness of its ranking algorithm. How it balances different signals — Stars, download counts, commit activity — is what determines whether the leaderboard is trustworthy. A tool that simply sorts by a single metric loses much of its value; one that offers multi-dimensional filtering and slicing by subcategory could become a genuinely useful daily reference for developers.
For anyone following the data visualization space, tools like this offer a low-effort way to get a broad sense of the ecosystem landscape. Their ultimate value depends on consistent maintenance and rigor in how the underlying data is handled.
Show HN (Show Hacker News) is a dedicated tag on the Hacker News platform where developers showcase projects, products, or prototypes they've built in order to get genuine feedback from the tech community. Unlike regular discussion threads, Show HN submissions are typically at an early stage — upvote counts and comment volume don't fully reflect technical merit, but rather how well the topic resonates with community interests and the timing of the post. Many now well-known open source tools — including early versions of Tailwind CSS and Excalidraw — made their first appearance as quiet Show HN posts. So 11 upvotes simply reflects a cold-start state within the HN community, and says nothing about the quality of the project itself.
Related articles

Will GitHub Die? Open Source Maintainer Burnout and the Collaboration Crisis in the AI Era
Lex Fridman podcast discussion on open source maintainer burnout and GitHub's predicament: massive pull requests overwhelm core maintainers, and AI worsens code bloat. Using math journal peer review and Poincaré conjecture verification as analogies, the article analyzes why verification in knowledge production must be deliberately slow, and how open source communities can avoid the failure mode of maintainers exiting.

Stop Building Cookie-Cutter AI Websites: 3 Tools That Transform Your Coding Agent
Three tools that boost AI coding agents: FFmpeg skill for local video editing in Claude Code and Cursor, Hallmark's 50 design themes to fix cookie-cutter AI sites, and Jailbreaks' 25+ model prompts.

How America's Gerontocracy Squeezes the Younger Generation
Americans over 55 hold nearly three-quarters of national wealth, alongside an 80-year-old president and elderly congressional leaders. The Atlantic's Idrees Kahloon explains how gerontocracy drives up housing costs, squeezes opportunities for the young, and explores zoning reform and child poverty reduction as practical fixes.