LENS: Reliability-Aware LLM Priors and News Semantic Graphs for Stock Prediction

LENS treats relationship reliability as a first-class signal, unifying static LLM-extracted graphs with dynamic news semantic graphs.
The article introduces the LENS framework, which fixes the flaw in traditional GNNs for stock prediction—treating all extracted edges as equally trustworthy facts—by making relationship reliability a first-class signal throughout. The static side uses multi-round LLM extraction with confidence-weighted aggregation to filter noisy edges via self-consistency, backed by human validation; the dynamic side builds news-driven semantic graphs with exponential decay for uneven coverage and timeliness; gated fusion balances both per stock per day. On S&P 500 and NASDAQ 100, AR@5 and SR@5 improve by double digits, with ablations isolating each component.
Title
LENS: Reliability-Aware LLM Priors and News Semantic Graphs for Stock Prediction
Meta Description
LENS introduces relationship reliability as a first-class signal in stock prediction: the static side uses multi-round LLM extraction plus confidence weighting to filter noisy edges, while the dynamic side uses news semantic graphs with exponential decay to capture market shifts. Gated fusion balances the two graphs per stock and per day. On S&P 500, AR@5 improves by 16.4% and SR@5 by 22.6%.
Article Content
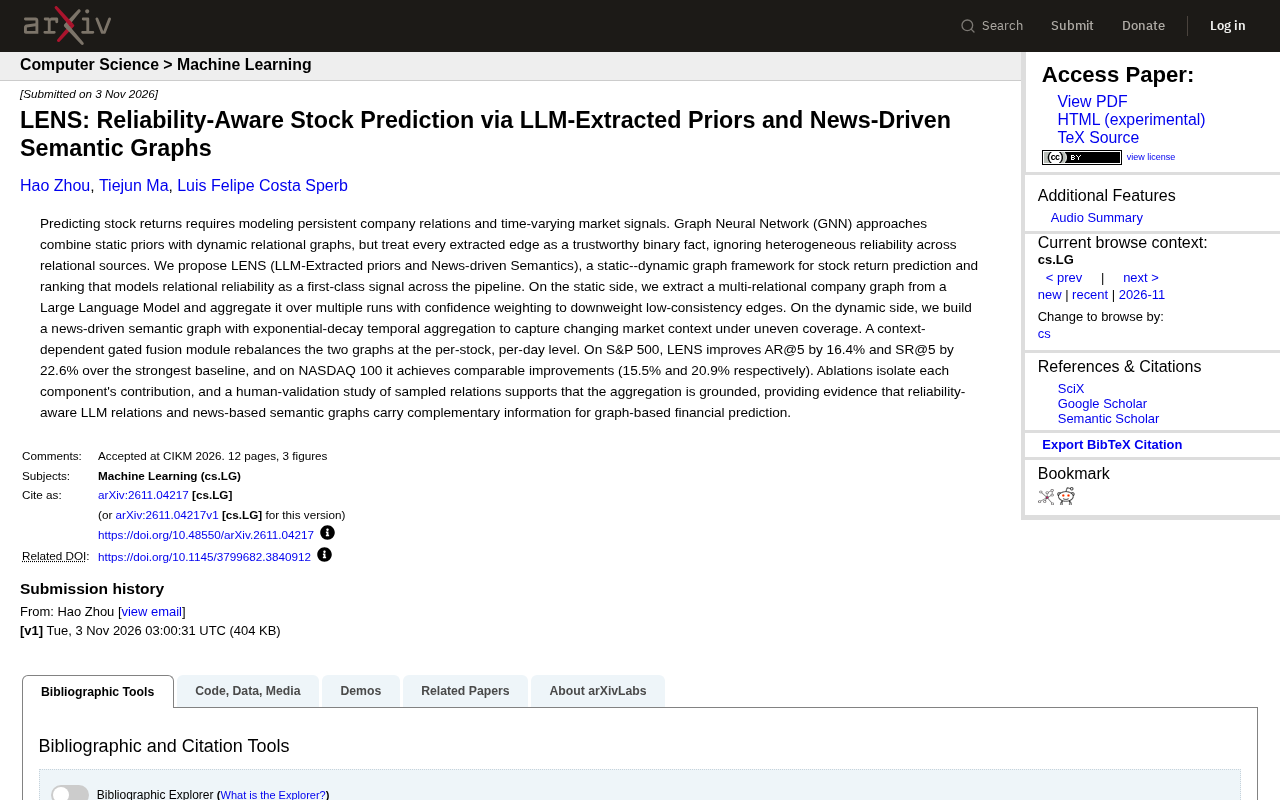
Predicting stock returns requires not only capturing long-term, stable relationships between companies but also reacting to market signals that change over time. Traditional graph neural network (GNN) methods combine static priors with dynamic relationship graphs, yet they implicitly assume that every extracted edge is an equally trustworthy fact—an assumption that ignores reliability differences across relationship sources. The recently proposed LENS framework attempts to treat "relationship reliability" as a first-class signal throughout the entire pipeline.
From "Binary Facts" to "Reliability Signals"
The core challenge in stock prediction is modeling two kinds of information: persistent relationships between companies (such as supply chains, competition, and cooperation), and market signals that fluctuate over time (such as news events and sentiment changes). GNN methods typically use static graphs for the former and dynamic graphs for the latter. The problem is that relationships extracted from either knowledge bases or text are treated as deterministic edges, without distinguishing which relationships are more reliable and which may simply be noise.
LENS starts from a straightforward premise: relationship extraction itself carries uncertainty, and reliability differences across sources should be explicitly modeled. According to the paper, the framework introduces reliability weighting mechanisms at both the static and dynamic levels instead of treating all edges equally.
Graph Neural Networks (GNNs) and Stock Relationship Modeling
A GNN is a type of neural network that performs message passing directly on graph structures: each node (here, a company) aggregates features from neighboring nodes to update its own representation, thereby encoding structural information about "who is related to whom" into the prediction. In stock prediction, nodes are listed companies, edges represent relationships such as supply chains, competition, and common ownership, and node features are price-volume indicators or financial data. Traditional approaches treat edges as unweighted or fixed-weight connections, so the model can only learn "related/not related" and cannot express "how trustworthy this relationship is." LENS changes exactly this—edge weights—by making reliability a learnable edge weight that participates in message passing, so noisy edges are naturally weakened during aggregation.
AR@5 and SR@5
AR@5 (Average Return at 5) refers to the average cumulative return of the model's top 5 recommended stocks each day over the holding period, measuring the absolute return capability of the stock-selection signal; SR@5 (Sharpe Ratio at 5) is the Sharpe ratio of the same top-5 portfolio, i.e., the ratio of excess return to volatility, measuring return efficiency per unit of risk. Why look only at the top 5? Because quantitative stock-selection strategies typically trade only the few highest-ranked names, so top-of-list precision is closer to real-world use than overall ranking. The two metrics should be read together: high AR with low SR means returns come with high volatility, which discounts practical tradability.
Static Side: Multi-Round LLM Extraction and Confidence Weighting
For static relationship graph construction, LENS uses a large language model to extract a multi-relational company graph and aggregates results across multiple runs, using confidence weighting to downweight low-consistency edges. The logic is: if the LLM consistently judges a relationship the same way across runs, that relationship is more likely real; if contradictions recur, its reliability is questionable.
This approach effectively turns the LLM's "self-consistency" into a proxy for relationship reliability. Compared with using a single extraction result directly, multi-round aggregation can filter out some noisy edges without additional annotation. The paper also conducts a human validation study checking sampled relationships, and the results show that this aggregation approach is justified—i.e., aggregated relationships align with human judgment.
LLM Self-Consistency
Self-consistency was originally a prompting and decoding strategy: sample multiple times from the same question at higher temperature to obtain multiple reasoning paths, then vote on the final answer and take the majority result as output. Its assumption is that correct answers are more likely to be reached repeatedly via different paths, while wrong answers tend to be randomly scattered. LENS transfers this logic from "answer voting" to "relationship extraction": extract the same company-pair relationship multiple times and count its frequency and consistency as a proxy for the relationship's reliability. This yields a continuous confidence score without manual annotation, at the cost of multiple LLM calls, with inference cost growing linearly with the number of rounds.
Dynamic Side: News-Driven Semantic Graphs and Temporal Decay
The core of the dynamic side is building a news-driven semantic graph and using an exponential decay temporal aggregation mechanism to capture the changing market context. News coverage is often uneven—some companies appear frequently in reports while others are rarely mentioned. LENS handles this uneven coverage through temporal decay: more recent news gets higher weight, and the decay mechanism also prevents old news from exerting too strong an influence on current judgments.
This design addresses a real problem in financial forecasting: market context changes quickly, and static relationship graphs cannot reflect short-term relationship changes caused by sudden events. News semantic graphs provide a complementary signal, but they too require reliability management, because news quality and coverage density vary widely.
Exponential Decay Aggregation
Exponential decay is a common technique for time-series aggregation: assign weight (e^{-\lambda(t_{\text{now}}-t)}) to an observation with timestamp (t), where (\lambda) controls the forgetting rate—older information gets lower weight but does not drop to zero instantly. Compared with the hard cutoff of sliding windows ("keep while in window, discard when out"), exponential decay is smooth weighting that preserves long-tail historical information while emphasizing recent signals. In LENS, decay acts on the edges of the news semantic graph: if a pair of companies is co-mentioned recently, their dynamic edge weight is higher; edges from old news naturally fade over time, preventing historical events from dominating current judgments long-term. The choice of (\lambda) is fundamentally a trade-off between "reaction speed" and "stability."
Gated Fusion: Rebalancing Per Stock and Per Day
On top of the static and dynamic graphs, LENS adds a context-dependent gated fusion module that rebalances the contribution of the two graphs at the level of each stock and each trading day. This means the model does not fixedly trust one side of the information but dynamically adjusts based on the current context.
Ablation experiments isolate the contribution of each component, showing that static reliability aggregation, dynamic semantic graphs, and gated fusion all play a role in overall performance. This per-stock, per-day granularity also matches intuition: different companies have different sensitivities to news, and the same company's reliance on static relationships can change across periods.
Gating Mechanism
Gating originates from recurrent networks such as LSTM. At its core is a scalar or vector in the range 0 to 1, dynamically generated from the current input via a function such as sigmoid, used to control how much weight each of two information streams receives. Compared with fixed weighted summation, gating lets the fusion coefficient vary with context: when a stock has dense recent news and clear semantic signals, gating can favor the dynamic graph; when news is sparse or noisy, it can fall back to the more stable static relationship graph. LENS pushes the gating granularity down to "each stock, each trading day," meaning every sample has its own fusion coefficient. This requires the gating network's input to include context features available for that stock on that day, and it also implies improved interpretability—one can observe when the model relies more on which side of the information.
Benchmark Performance: Gains on S&P 500 and NASDAQ 100
The paper evaluates on two stock pools, S&P 500 and NASDAQ 100. On S&P 500, LENS improves AR@5 by 16.4% and SR@5 by 22.6% over the strongest baseline; on NASDAQ 100 it achieves comparable improvements of 15.5% and 20.9%, respectively. These metrics measure the cumulative return and Sharpe ratio of the top-5 predictions, and the magnitude of improvement is meaningful in quantitative stock-selection settings.
It should be noted that these numbers come from the experimental setup reported in the paper; actual trading performance would also be affected by factors such as transaction costs, slippage, and market regime. Methodologically, however, incorporating reliability as an explicit signal into the graph construction pipeline offers a noteworthy direction for graph-based financial forecasting.
Why Reliability Awareness Matters
The core contribution of LENS is not inventing a new GNN architecture but redefining what an "edge" means—from a binary fact to a signal with a reliability weight. This shift in perspective is especially natural in finance, because financial relationship data is itself full of noise and time variability.
More broadly, the combination of LLM-extracted priors and news semantic graphs provides an interpretable intermediate layer: the static graph gives structured company associations, the dynamic graph captures event-driven semantic changes, and the gating mechanism lets the two collaborate according to context. The paper's human validation study also provides preliminary evidence for the usability of LLM-extracted relationships.
For researchers focused on deploying AI in finance, the lesson from LENS is this: rather than pursuing more complex graph networks, first characterize the reliability of input signals clearly. Reliability weighting, multi-round aggregation, and temporal decay are not novel mechanisms in themselves, but unifying them into one framework and treating them as first-class signals is what makes this work worth attention.
One-line Summary
LENS treats relationship reliability as a first-class signal, unifying static LLM-extracted graphs with dynamic news semantic graphs.
Paragraph Summary
The article introduces the LENS framework, which addresses the flaw in traditional graph neural networks for stock prediction—treating all extracted edges as equally trustworthy facts—by proposing "relationship reliability" as a first-class signal throughout the pipeline. On the static side, a large language model extracts company relationships over multiple rounds and aggregates them by confidence, using self-consistency to filter noisy edges, supported by a small human validation study; on the dynamic side, it builds news-driven semantic graphs and uses exponential decay to handle uneven news coverage and timeliness; a gated fusion module dynamically balances the contributions of both sides at the level of each stock and each trading day. On S&P 500 and NASDAQ 100, AR@5 and SR@5 both improve by double-digit percentages, and ablation experiments isolate the role of each component. The article argues that its core value lies not in a new network architecture but in redefining what an "edge" means.
Related articles

AI Tools Quietly Altering Settings: Postman Silently Installs Plugin, Codex Sharing Option Auto-Resets
AI Daily reports: Postman silently installs a Mac plugin and self-approves startup hooks, logged as auto-existing upgrade; Hacker News developers say Codex data-sharing opt-out flips back. Plus Simon Willison's raw float weight experiment with QEN 3.8-27B.

AI Learns to Rewrite AI: MIT's "Weightspace Programming" Redraws the Path to Recursive Self-Improvement
MIT team proposes weightspace programming: GPT-6 Astra reads and edits AI model weights directly. Math scores jump several-fold, hand-written networks beat trained models. Eight experiments analyzed, plus Anthropic's same-day warning and the real boundaries of recursive self-improvement.

Running Qwen 3.8 on a Laptop to Read Raw Weights: 46 Minutes Per Answer
Simon Willison reproduced weight space programming with Qwen 3.8 27B on a laptop: a 17GB model file, 46 minutes per answer, 43,506 reasoning tokens, Pong over an hour, Freeway failed. Suited for interpretability researchers.